
Google Shopping Ads for a Home Textiles Store: 27 Purchases in 25 Days

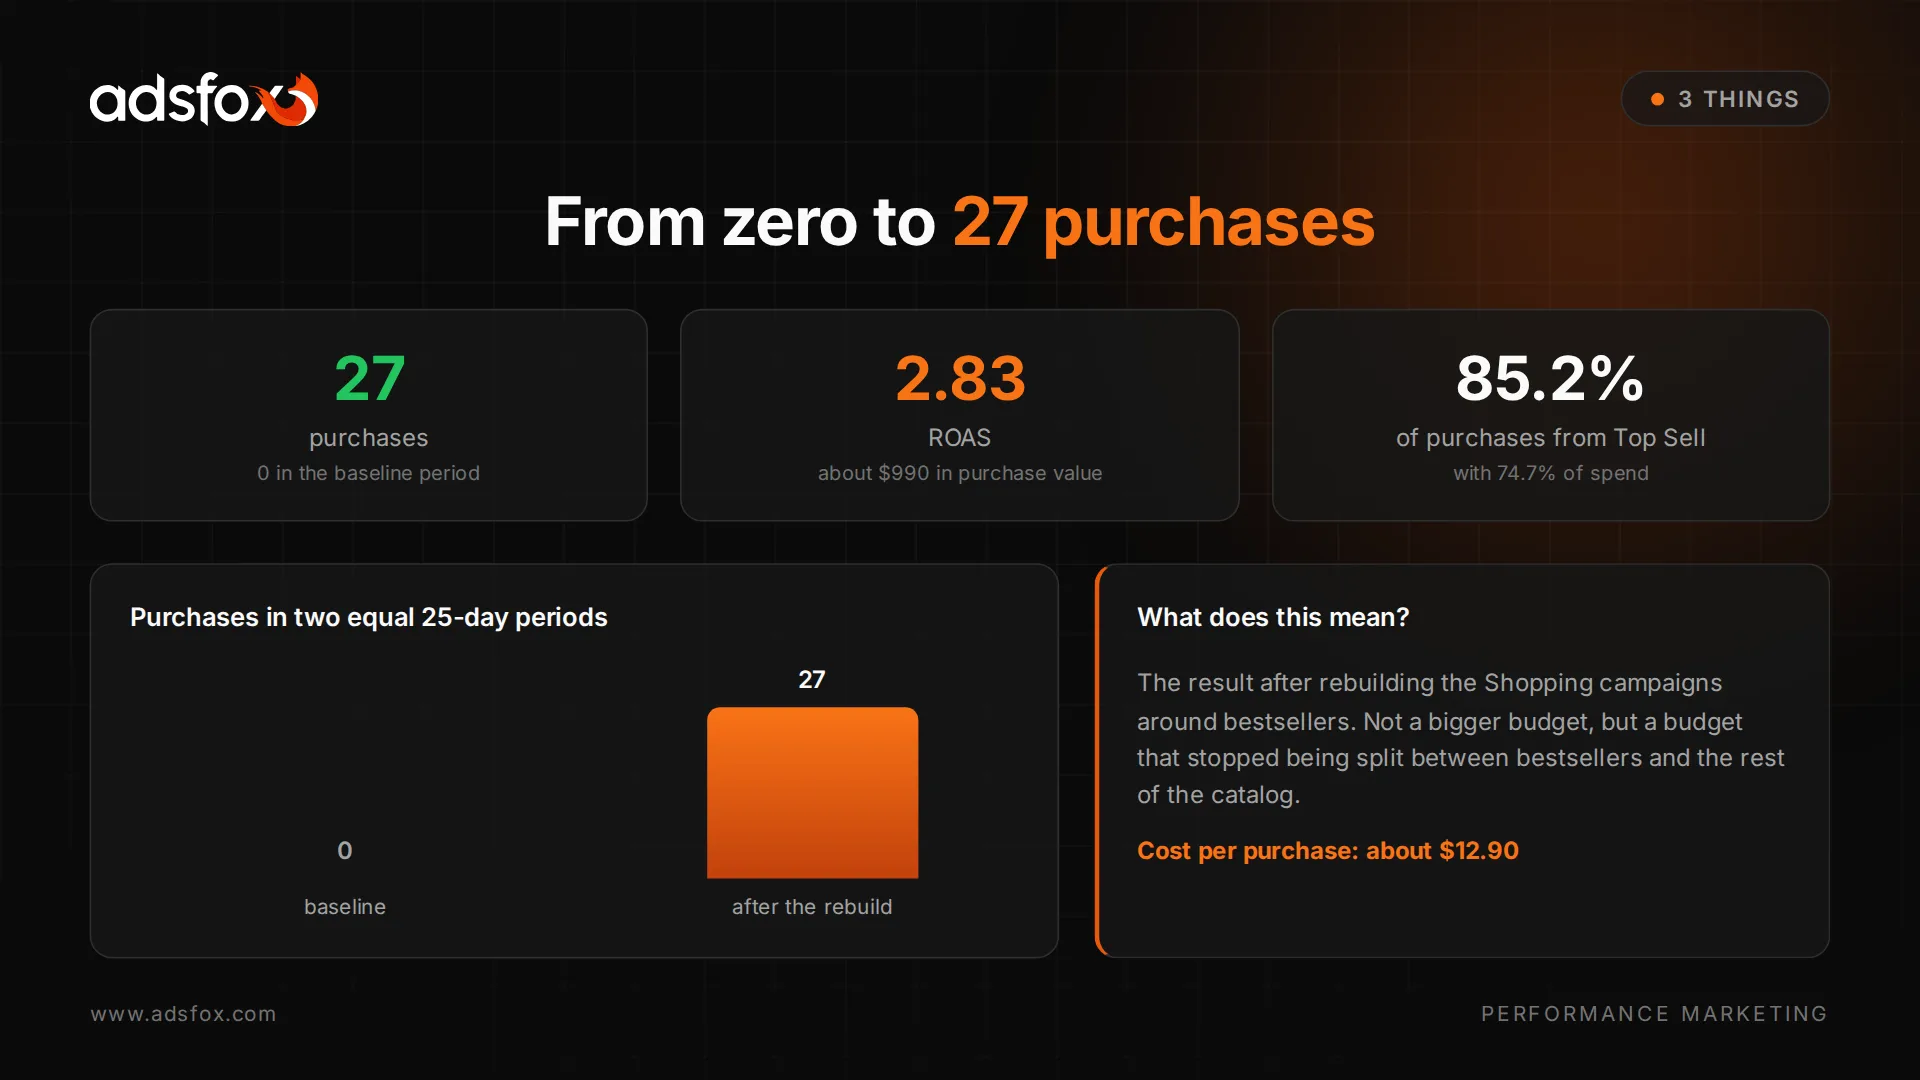
In an equal baseline period, the store spent about $230 and recorded no purchases. After the Shopping campaigns were rebuilt, there were 27 purchases in 25 days, purchase value reached about $990, and real ROAS came in at 2.83.
The biggest change was not a bigger budget. It was that the bestsellers stopped competing for the same money with the rest of the catalog.
Screenshots show amounts in Polish zloty (PLN); in the text we converted them to US dollars at roughly 4 PLN per dollar.
Results in short
| Metric | Baseline: 25 days | After the change: 25 days |
|---|---|---|
| Cost | about $230 | about $350 |
| Purchases | 0 | 27 |
| Cost per purchase | no basis to calculate | about $12.90 |
| Purchase value attributed in Google Ads | $0 | about $990 |
| ROAS | 0.00 | 2.83 |
The first purchase came the day after the campaigns were relaunched. Sales continued through the rest of the analyzed period.
Important: the values show the result attributed in Google Ads, not the store’s accounting profit. We compare two equal 25-day periods.
Source: internal campaign analysis and the client’s Google Ads data.
Starting point: budget spread across the whole catalog
The store, a client in Poland, sells bathrobes, towels, pajamas, slippers, throws, tablecloths, table runners, napkins and other home and bath textiles online.
Shopping campaigns had been running before, but their structure did not send budget to the products that were actually generating sales. The main problems:
- no separate place for bestsellers,
- the same products overlapping between campaigns,
- inconsistent categories and inconsistent ID and SKU identifiers,
- inventory problems,
- new GTINs (EANs) that did not always match the identifiers already in the system,
- the whole catalog treated as one broad group.
In practice, a good product could be competing for budget with a variant that sold worse or should not have been promoted in that campaign at all.
What we changed in the campaigns and Merchant Center
1. We built a bestseller list
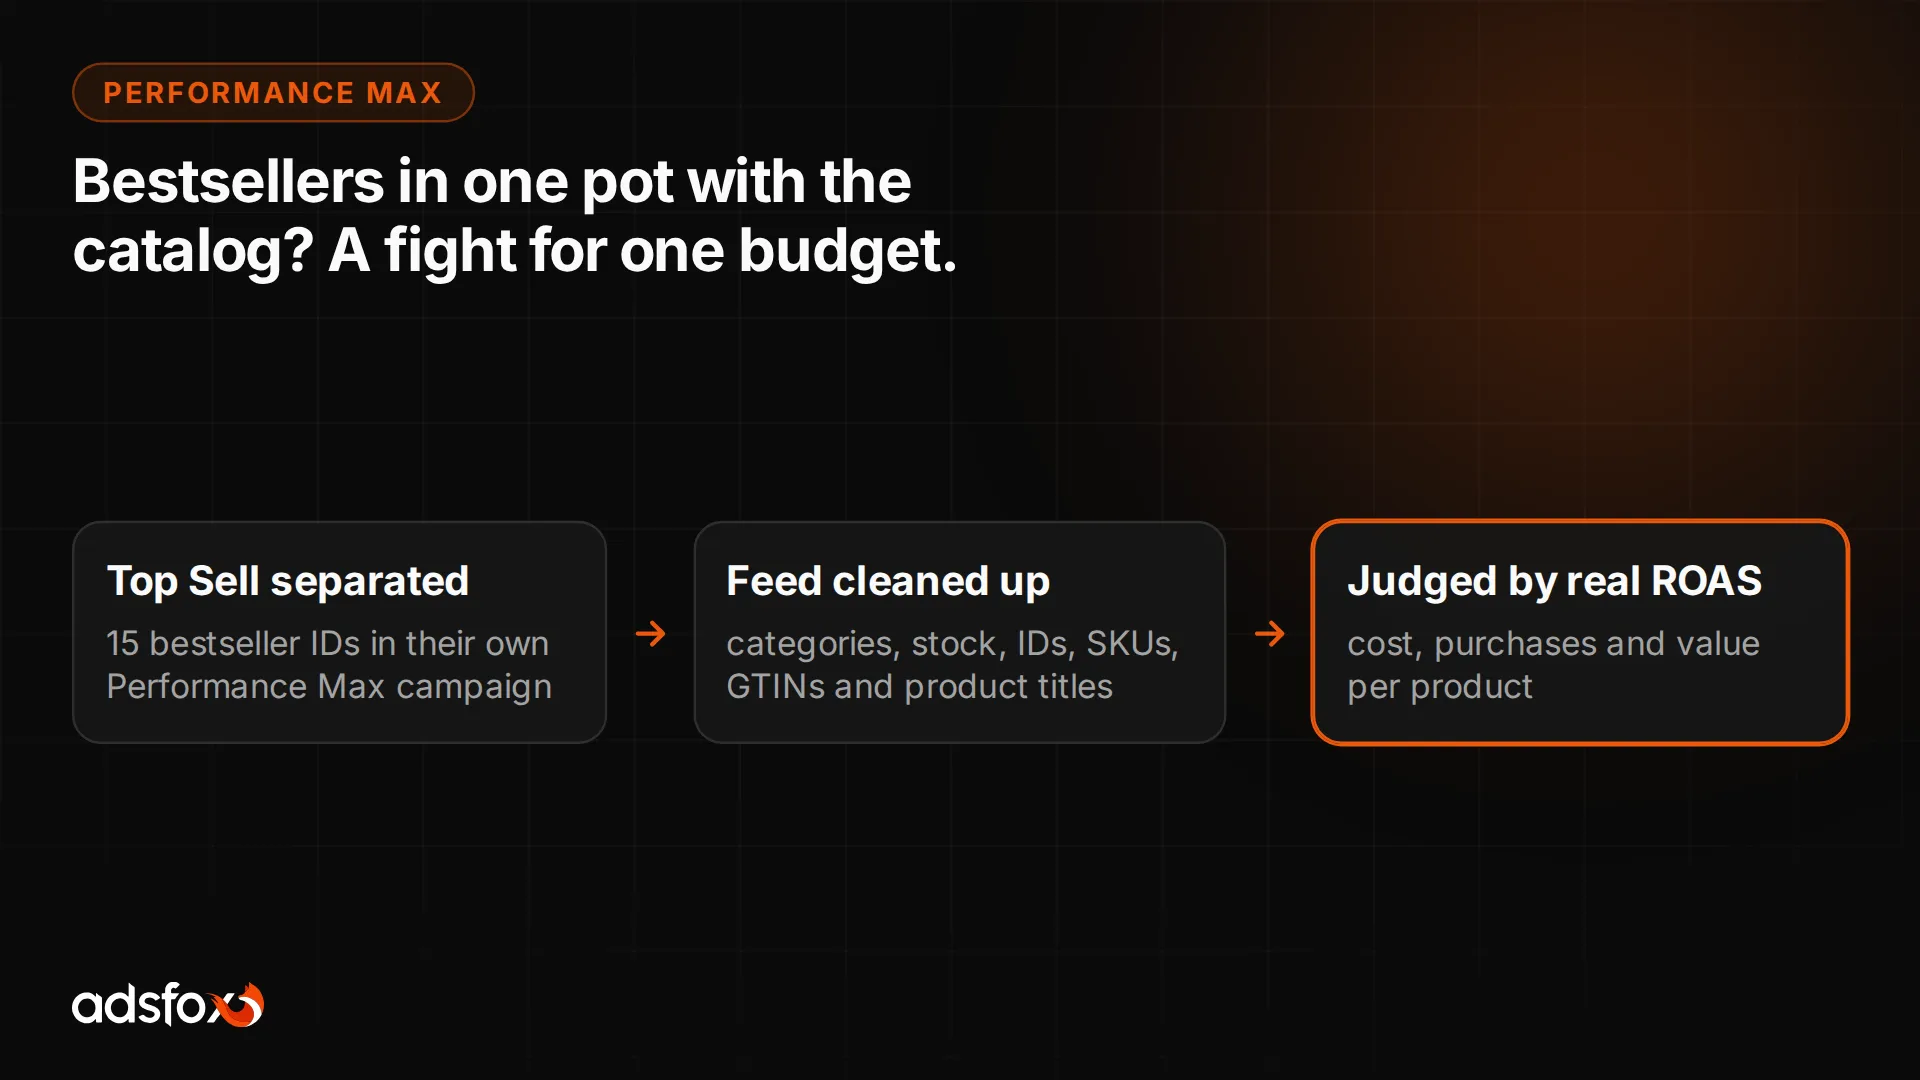
Based on sales data, we created a list of 15 specific product IDs that went into a separate Performance Max campaign called Top Sell.
We did not judge whole categories by name. Decisions were made at the level of the individual product and its actual results.
2. We separated Top Sell from the rest of the catalog
The structure after the change included:
- a separate Performance Max campaign for Top Sell,
- a separate Performance Max campaign for the remaining products,
- a later test campaign focused on bathrobes.
The starting budget was about $17.50 a day: about $12.50 for Top Sell and about $5 for the rest of the catalog. A bathrobe test at about $1.75 a day was added later.
3. We cleaned up the product feed
The review covered categories, inventory, IDs, SKUs and GTINs. We also checked variants, images and product titles.
In textiles, even the order of information in a title matters. If a shopper is looking for size 3XL to 5XL, that information should be visible right away, not buried at the end of a long product name.
4. We optimized for purchases and purchase value
The goal was not a nice-looking metric in the campaign settings. What counted was real ROAS, cost per purchase and sales attributed to specific products.
Original data from the Google Ads dashboard
Below are full dashboard screenshots with the client’s data anonymized. These are not recreated charts or manually retyped tables.
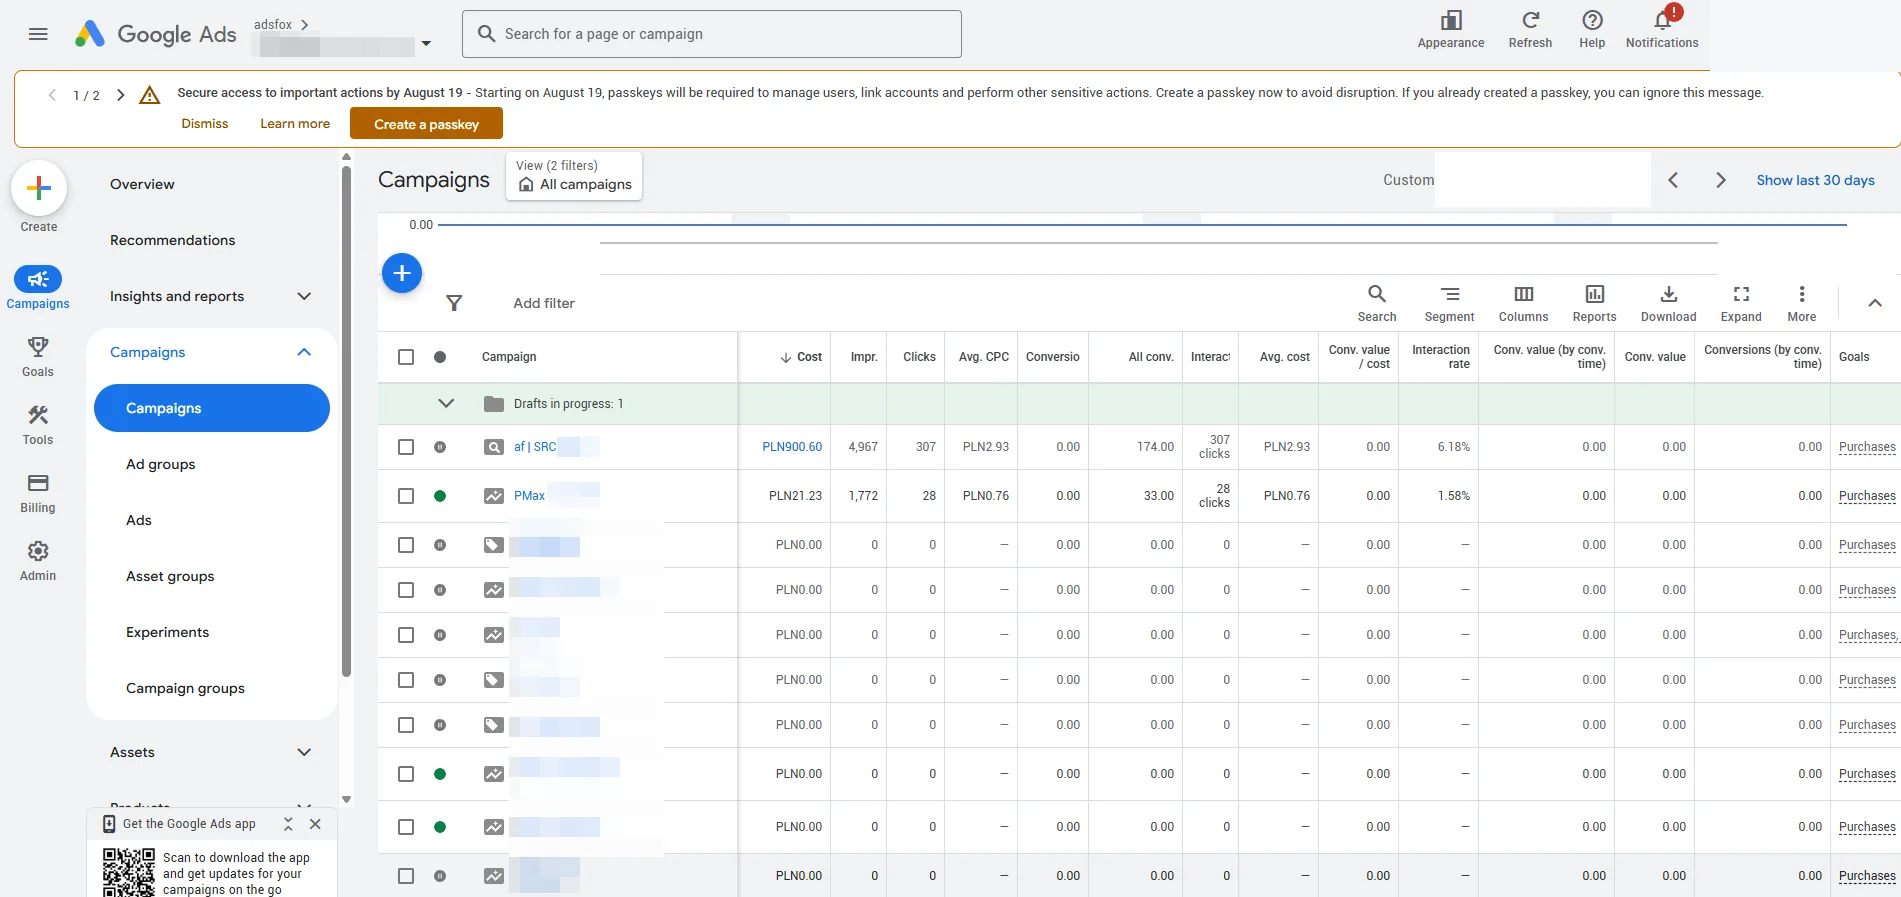
In the baseline period, the active campaigns spent a combined 921.83 PLN (about $230) and recorded no purchases.
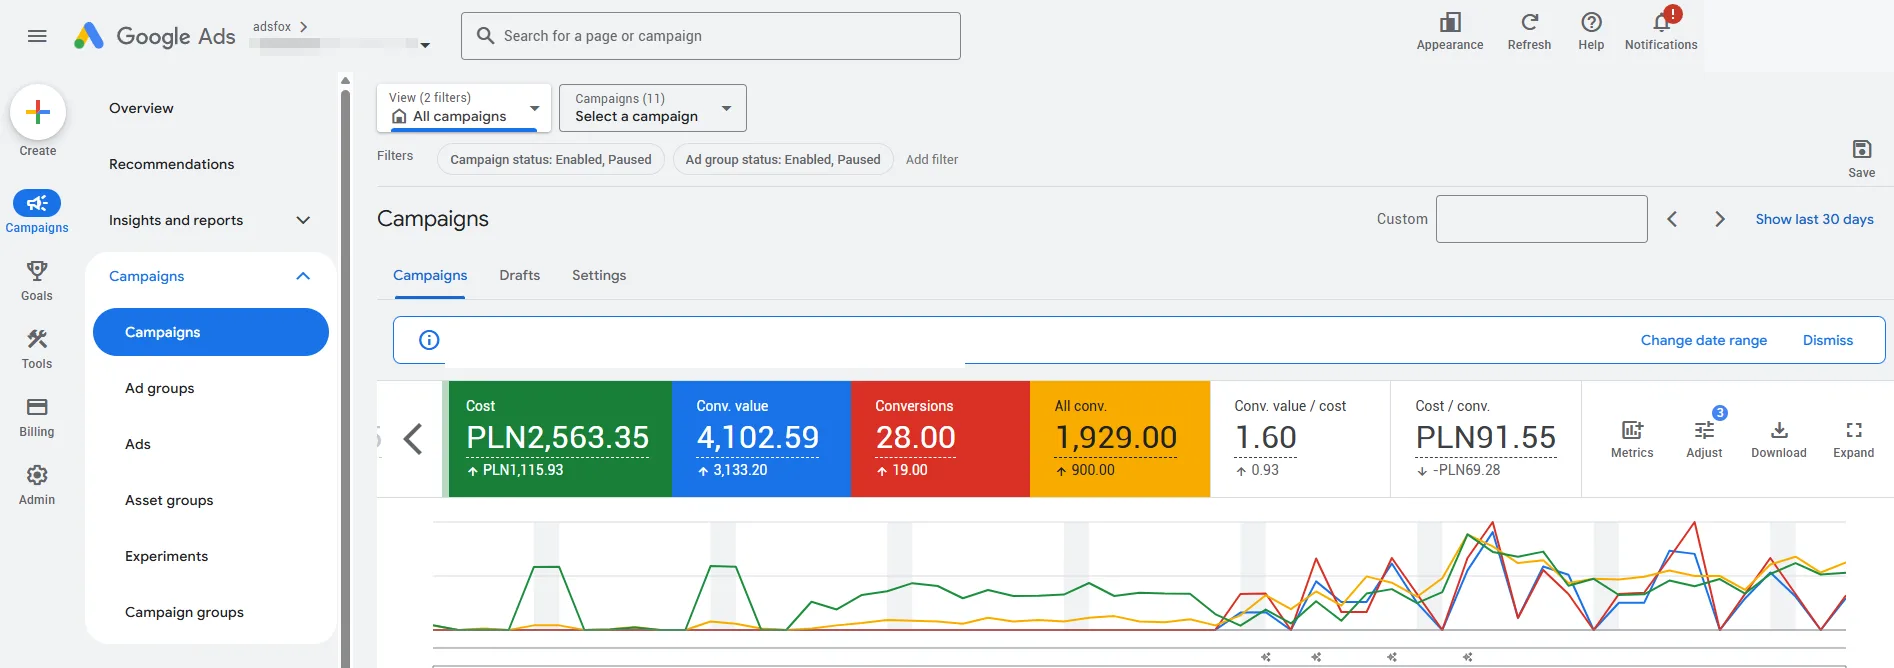
The longer trend shows the moment the account went from no purchases to regularly recorded conversions.
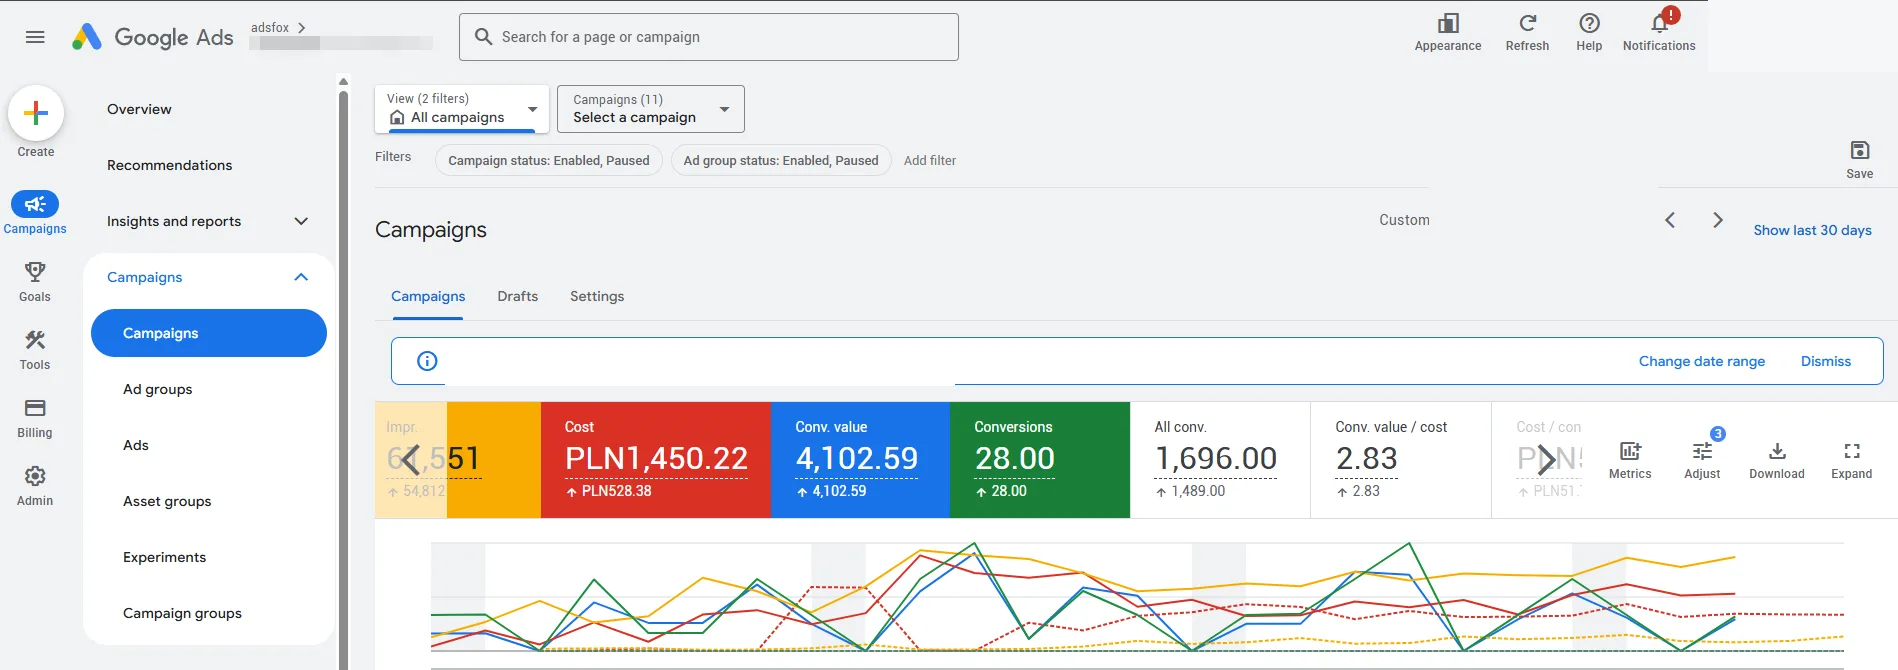
The full account view shows 28 conversions and 4,102.59 PLN (about $1,025) in value in the standard Google Ads columns.
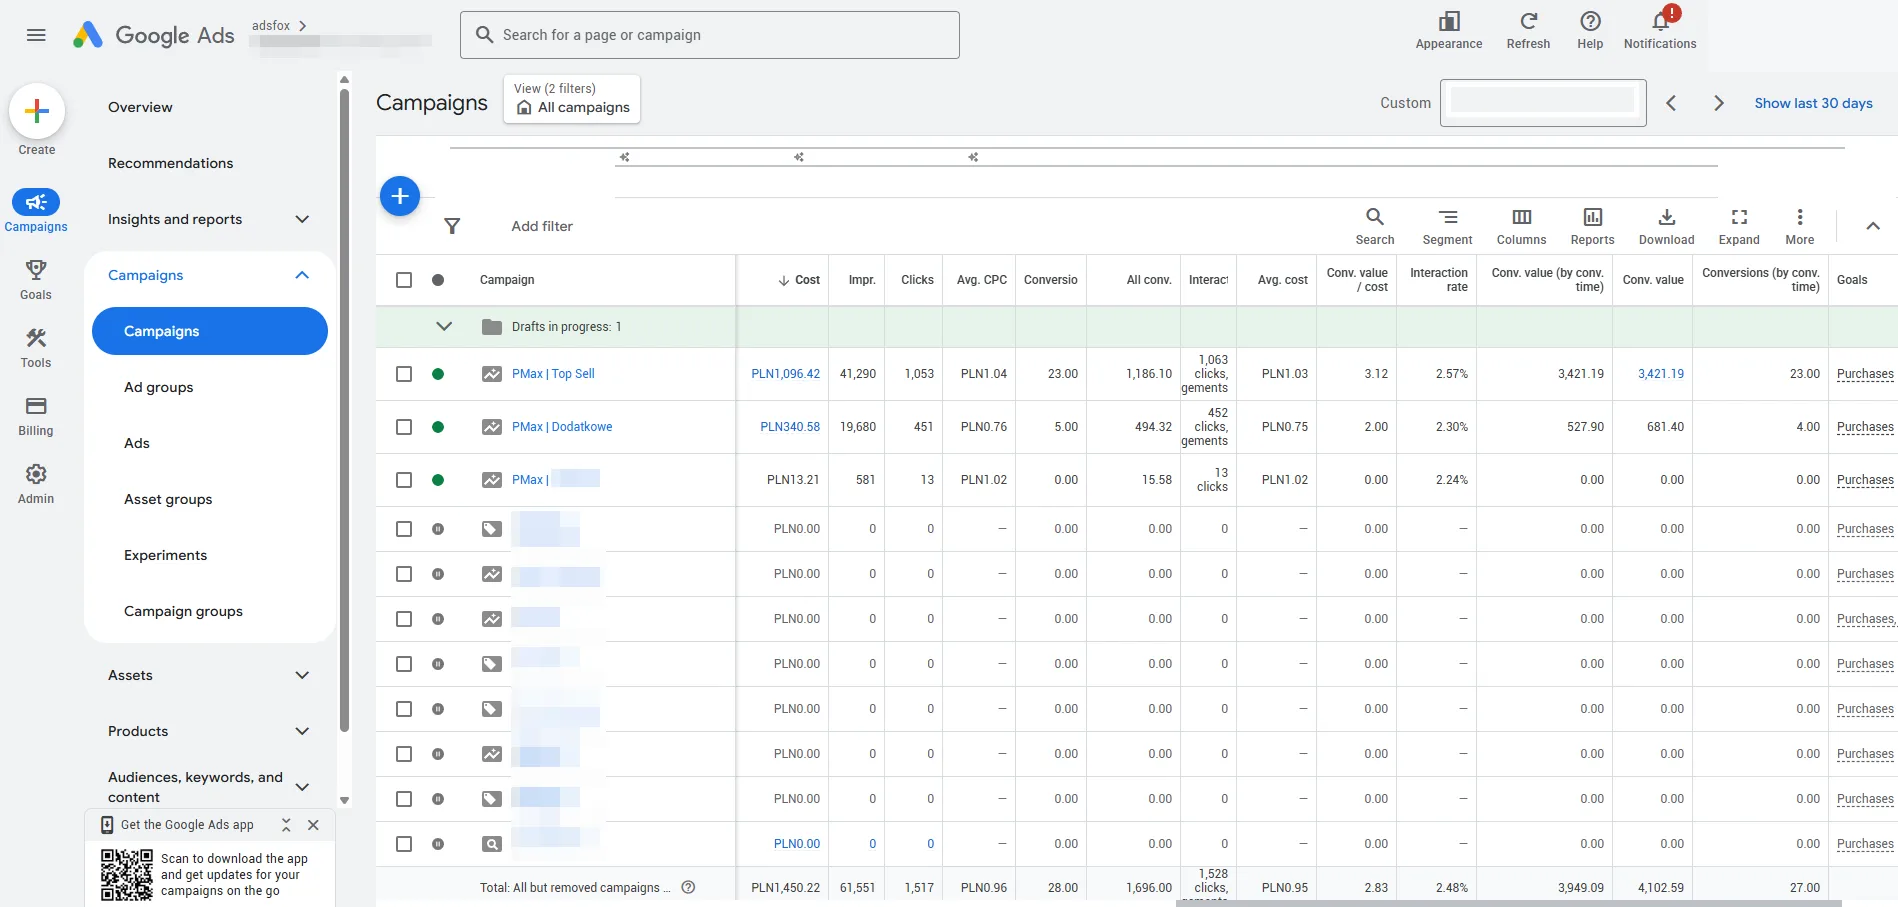
In the “by conversion time” columns, the same view shows 27 purchases and 3,949.09 PLN (about $990) in value. We use this consistent range for the main comparison.
Google Ads can show different values in the standard columns and in the “by conversion time” view. On top of that, the full account view includes more cost than the analyzed Shopping campaigns alone. That is why we do not mix these numbers in one comparison.
Why Top Sell worked best
The Top Sell segment accounted for:
- 74.7% of spend,
- 85.2% of purchases,
- 86.6% of sales value attributed in Google Ads.
In the product-level analysis, Top Sell reached a ROAS of 3.28 and a cost per purchase of about $11.30. The rest of the catalog reached a ROAS of 1.59 and a cost per purchase of about $20.80.
That does not mean every product outside Top Sell was weak. The result does show that the bestsellers needed their own budget and their own optimization rules.
What still needed work
This case study does not end with “everything fixed.” A later audit found residual overlap.
Products marked as not intended for promotion still spent about $3.30 with no purchase. In the first 15 days after the change, at least about $96 of Shopping spend brought no sales.
That is an uncomfortable but business-critical part of the result: the rebuild produced sales, but the feed and product hierarchy still needed control.
Which products and queries generated sales
The best results clustered around:
- terry bathrobes,
- men’s bathrobes and plus-size models,
- large microfiber towels,
- waffle-weave products,
- hotel bathrobes.
The most clicks without a purchase came from, among others, selected queries for women’s terry bathrobes, men’s cotton bathrobes, waffle towels, and linen napkins and table runners.
This comes from the Search Term Insights categories, not a full list of exact queries. The number of clicks alone is also not enough to judge profitability without the cost assigned to a specific category.
What this means for e-commerce stores with a wide catalog
A bestseller should have a protected budget
If a product sells, it should not have to wait for the algorithm to fight through hundreds of weaker SKUs. A separate Top Sell segment makes budget management and evaluating the real result easier.
The feed is part of the campaign, not a technical file
A wrong GTIN, outdated stock or an inconsistent ID can send a product into the wrong campaign, duplicate it, or cost it its data history.
Target ROAS is no substitute for real sales
The goal you set in a campaign does not answer whether a specific category makes money. You need cost, purchase and value analysis at the product level.
Structure has to be checked regularly
Even after a rebuild, overlap can remain. That is why the product list, feed, inventory and campaign assignments need a recurring audit.
What comes next
The next steps include:
- further separation of Top Sell from the rest of the catalog,
- moving products based on actual sales,
- removing residual overlap,
- controlling IDs, SKUs, GTINs and inventory,
- reviewing budgets and target ROAS based on real results,
- creating separate campaigns or asset groups only for the products that belong in them.
Do you run an online store with a wide catalog and not know which products are actually driving your Google Ads results? Book a free marketing consultation with adsfox. We will review your campaign structure, feed and budget split.
See also:
- how our Google Ads agency runs campaigns,
- Google Ads case study for a jewelry e-commerce store,
- more adsfox case studies.
Related adsfox services
We run Shopping and Performance Max campaigns as part of our Google Ads agency services, and sales campaigns on Facebook and Instagram through our Facebook ads agency. Organic search traffic is built separately, through our SEO agency, including e-commerce SEO. Recovering conversions lost to browser tracking limits is handled by server side tracking and the Conversions API, and you can find results from other projects in our case studies.