
Google Ads for a Jewelry E-commerce Store: ROAS Up 116.3%

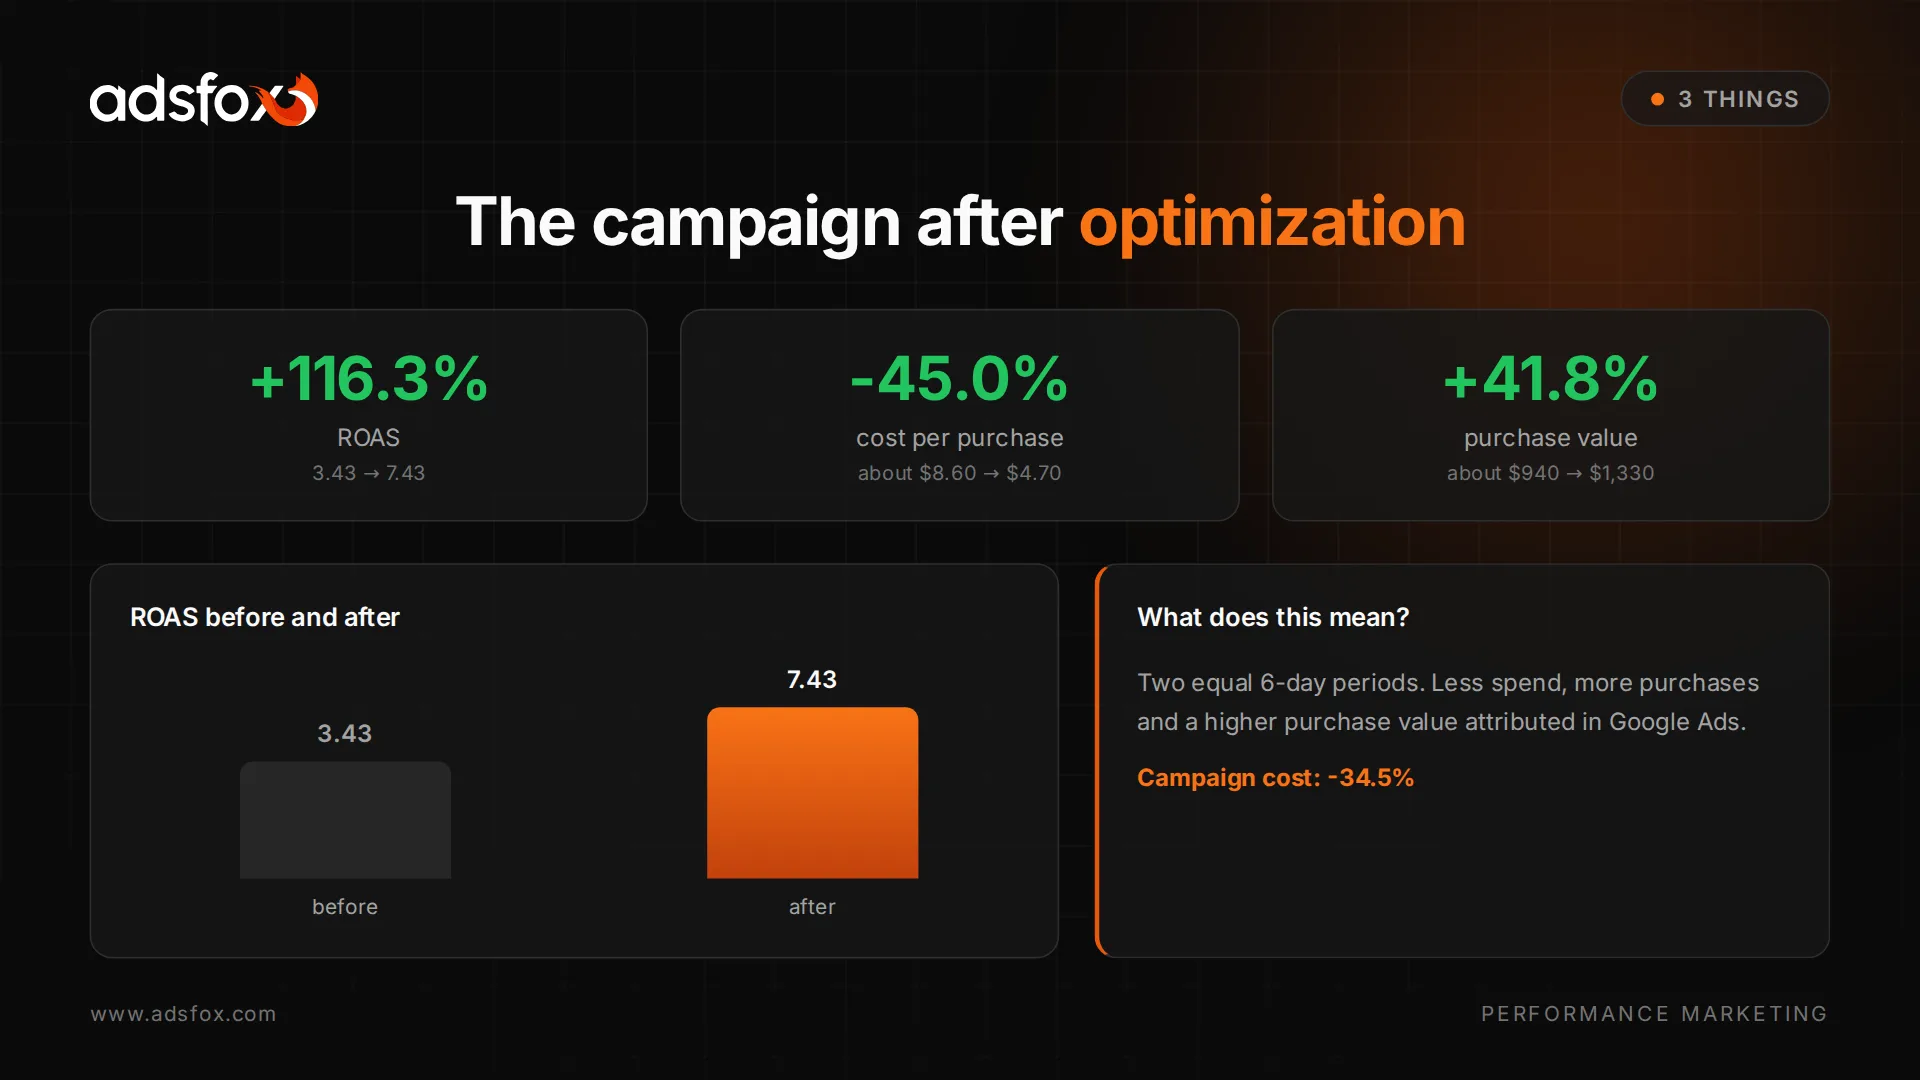
Google Ads for a jewelry e-commerce store can grow sales without growing cost, once the budget stops flowing to randomly grouped products. In this project for a European client, after cleaning up the feed, Merchant Center and campaign structure, ROAS went from 3.43 to 7.43, cost per purchase dropped from about $8.60 to about $4.70, and purchase value attributed in Google Ads grew 41.8%. We compare two equal 6-day periods, so we treat the result as a strong signal after optimization, not a guarantee of the long-term level.
Screenshots show amounts in Polish zloty (PLN); in the text we converted them to US dollars at roughly 4 PLN per dollar.
Google Ads for a jewelry store: the results in short
The biggest change was not a simple budget increase. In the period after optimization, ad cost was 34.5% lower, and the campaigns generated more attributed purchases and higher purchase value.
| Metric | Before | After changes | Change |
|---|---|---|---|
| Campaign cost | about $273 | about $179 | -34.5% |
| Attributed purchases | 31.78 | 37.90 | +19.3% |
| Cost per purchase | about $8.60 | about $4.70 | -45.0% |
| Purchase value | about $940 | about $1,330 | +41.8% |
| ROAS | 3.43 | 7.43 | +116.3% |
The source of these numbers is the Google Ads dashboard. “Purchase value” means the conversion value attributed by the ad platform, not the company’s confirmed total revenue or the store’s margin.
Starting point: a catalog with no clear segmentation
The store had been running Google Ads and Meta Ads before, but in Google the problem was not a lack of traffic. The biggest limitation was the structure of the Shopping setup:
- products were assigned to campaigns too broadly,
- product categories had no clear split,
- the feed and Merchant Center needed cleanup,
- products from the wrong categories were showing up in campaigns,
- SKU overlap and out-of-stock products had to be brought under control.
For a jewelry store, this kind of mess is especially expensive. Charms, bracelets, rings and earrings can have different margins, demand and sales velocity. If all of them land in the same campaigns with no clear rules, the system optimizes the result of the whole pool, and the business loses sight of which categories actually make money.
What we changed in Merchant Center and the campaigns
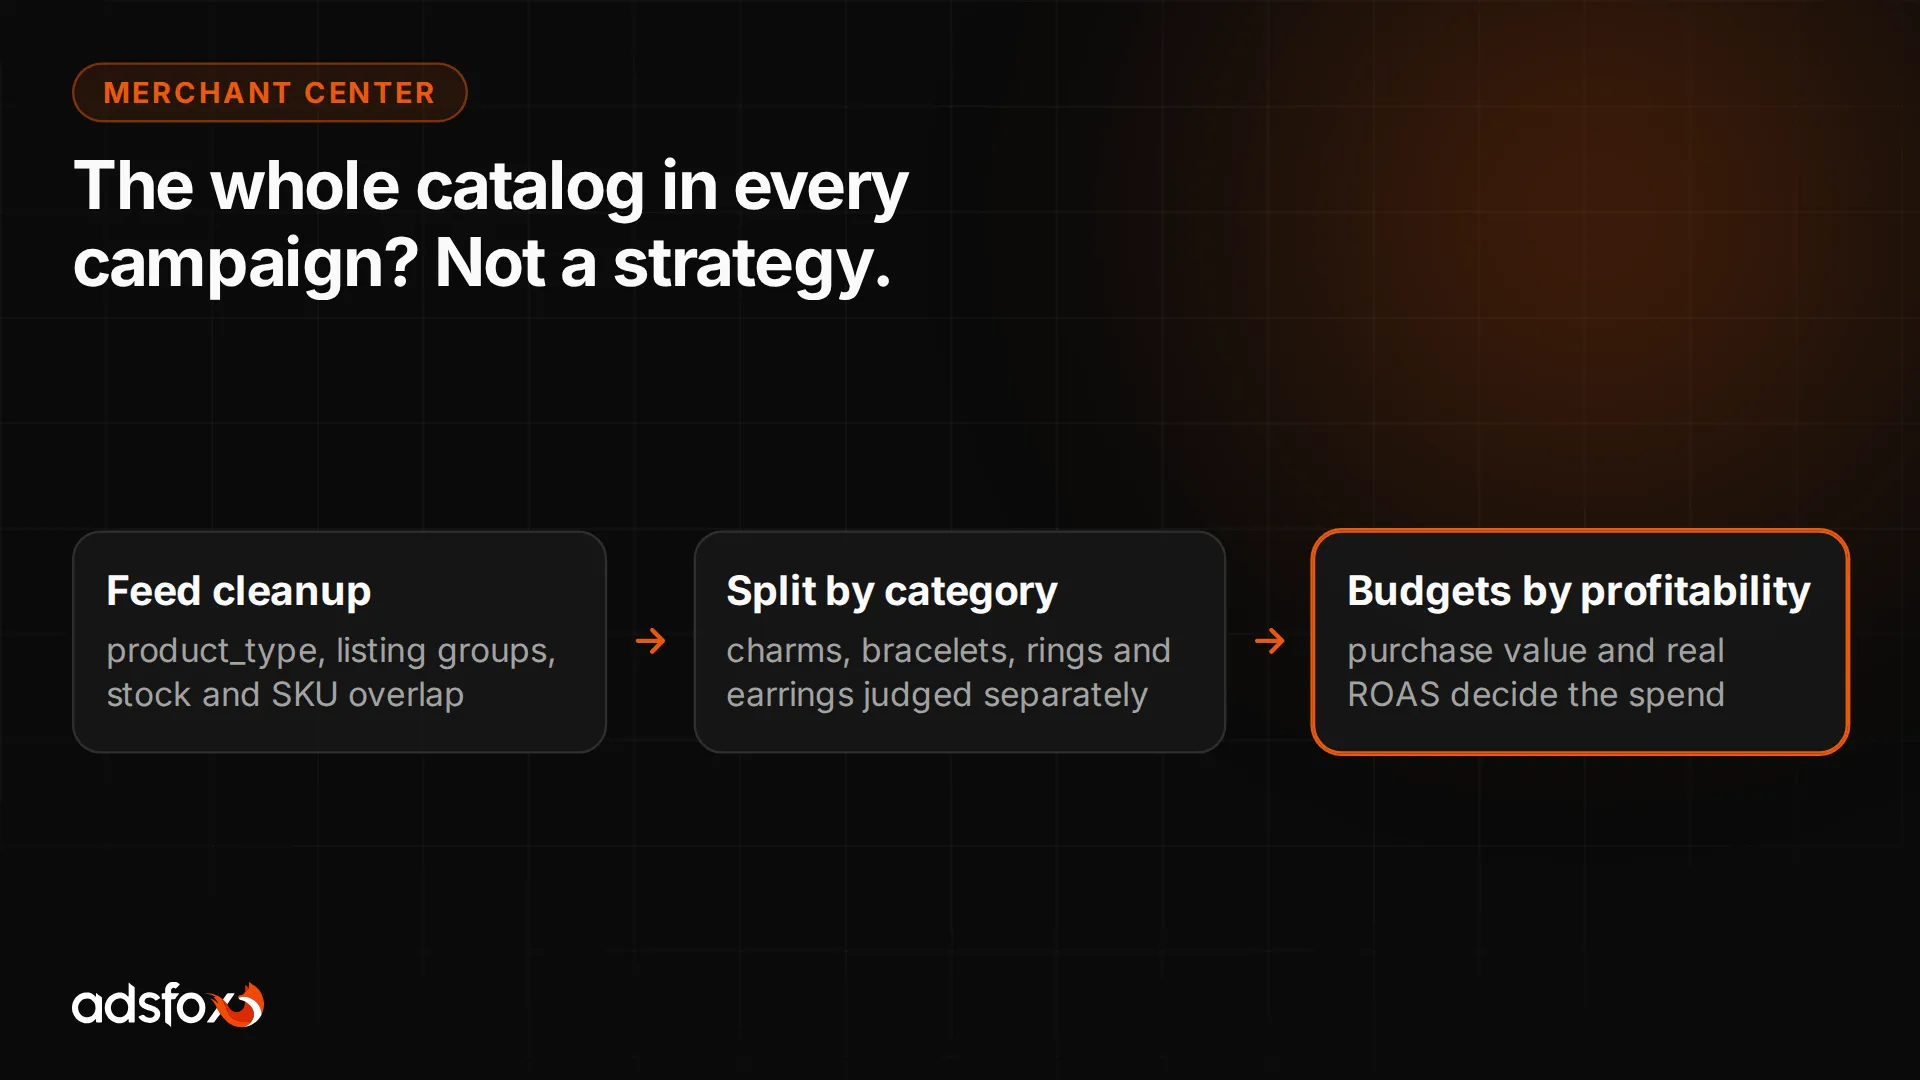
We started with the product data. We cleaned up product_type and listing groups, then assigned products to the right categories and campaigns. That made it possible to evaluate categories with different profitability separately.
In practice, the work covered:
- cleaning up the feed and the existing Merchant Center,
- splitting products between campaigns and categories,
- creating separate asset groups for selected categories,
- building out Search, Performance Max and feed-only Shopping campaigns,
- shifting budget based on purchase value and category profitability,
- controlling unavailable products and SKU overlap,
- optimizing for purchases, purchase value and real ROAS.
We did not judge campaigns by the target ROAS set in the system. What matters to the business is how much purchase value comes back from the budget actually spent, and whether the result clears the store’s break-even point. In this project, the threshold for scaling was a ROAS of 5.00.
Original results from the Google Ads dashboard
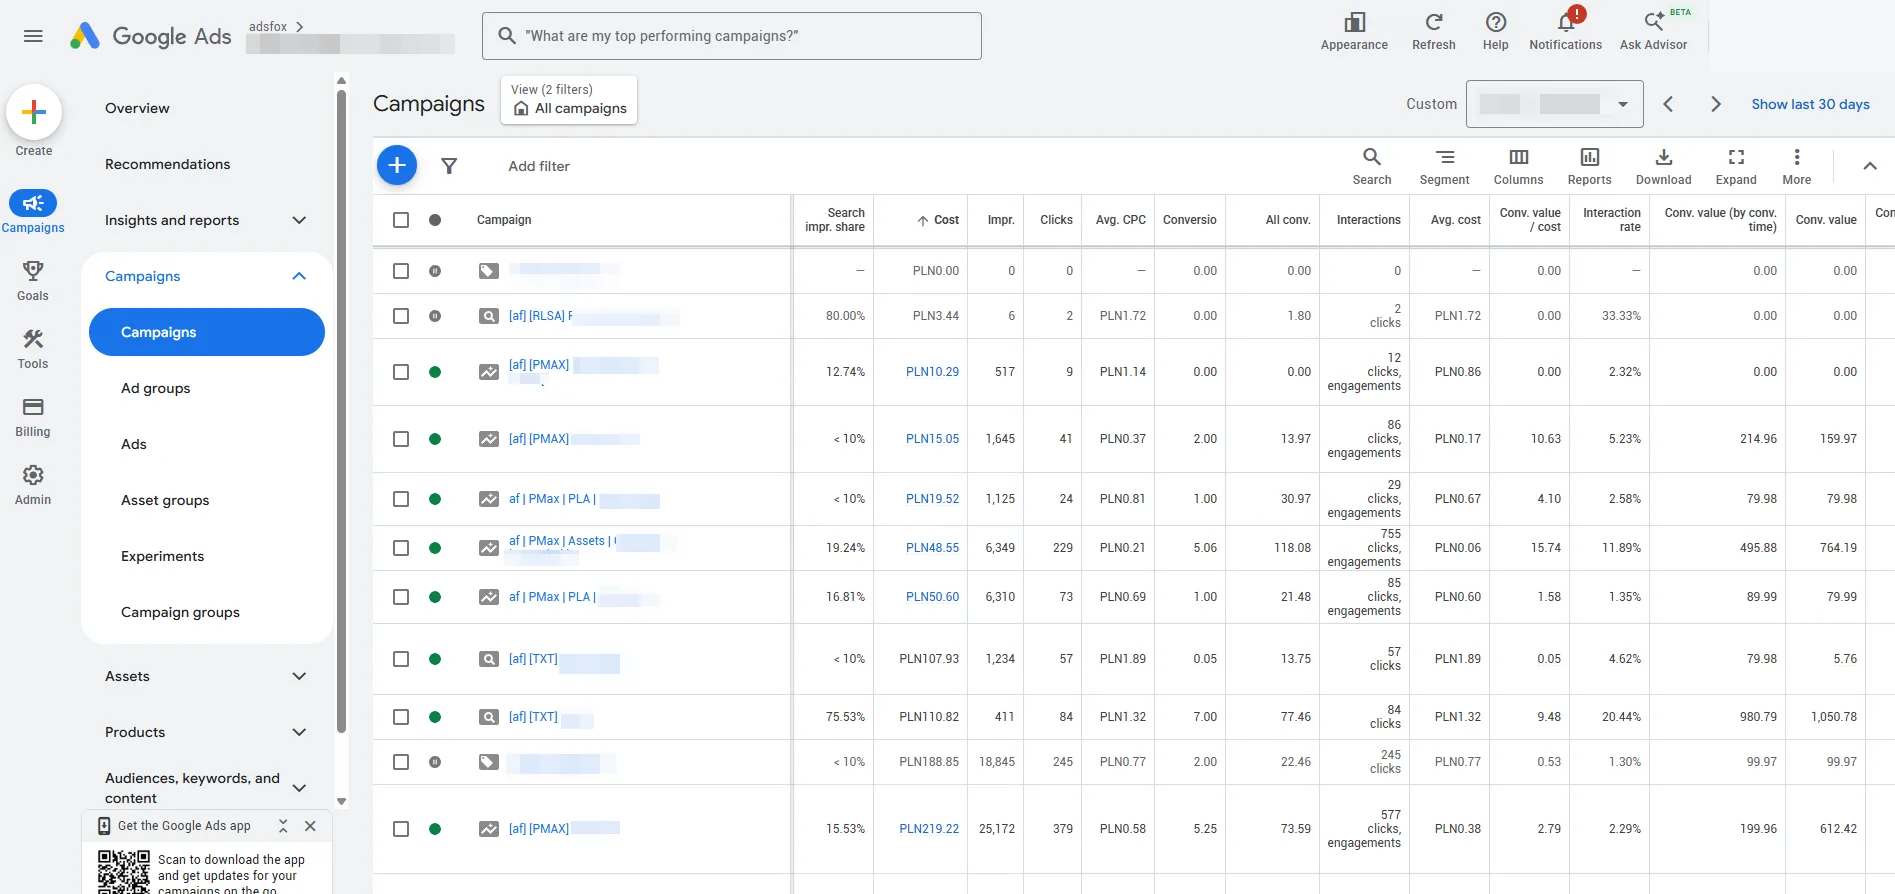
Below are three full screenshots from the dashboard. The account name, IDs, campaign names, exact dates and user details are hidden, but the table layout and the result values are unchanged.
The first screenshot shows the campaign structure in the earlier period. You can see Search, Performance Max and feed-based Shopping campaigns.
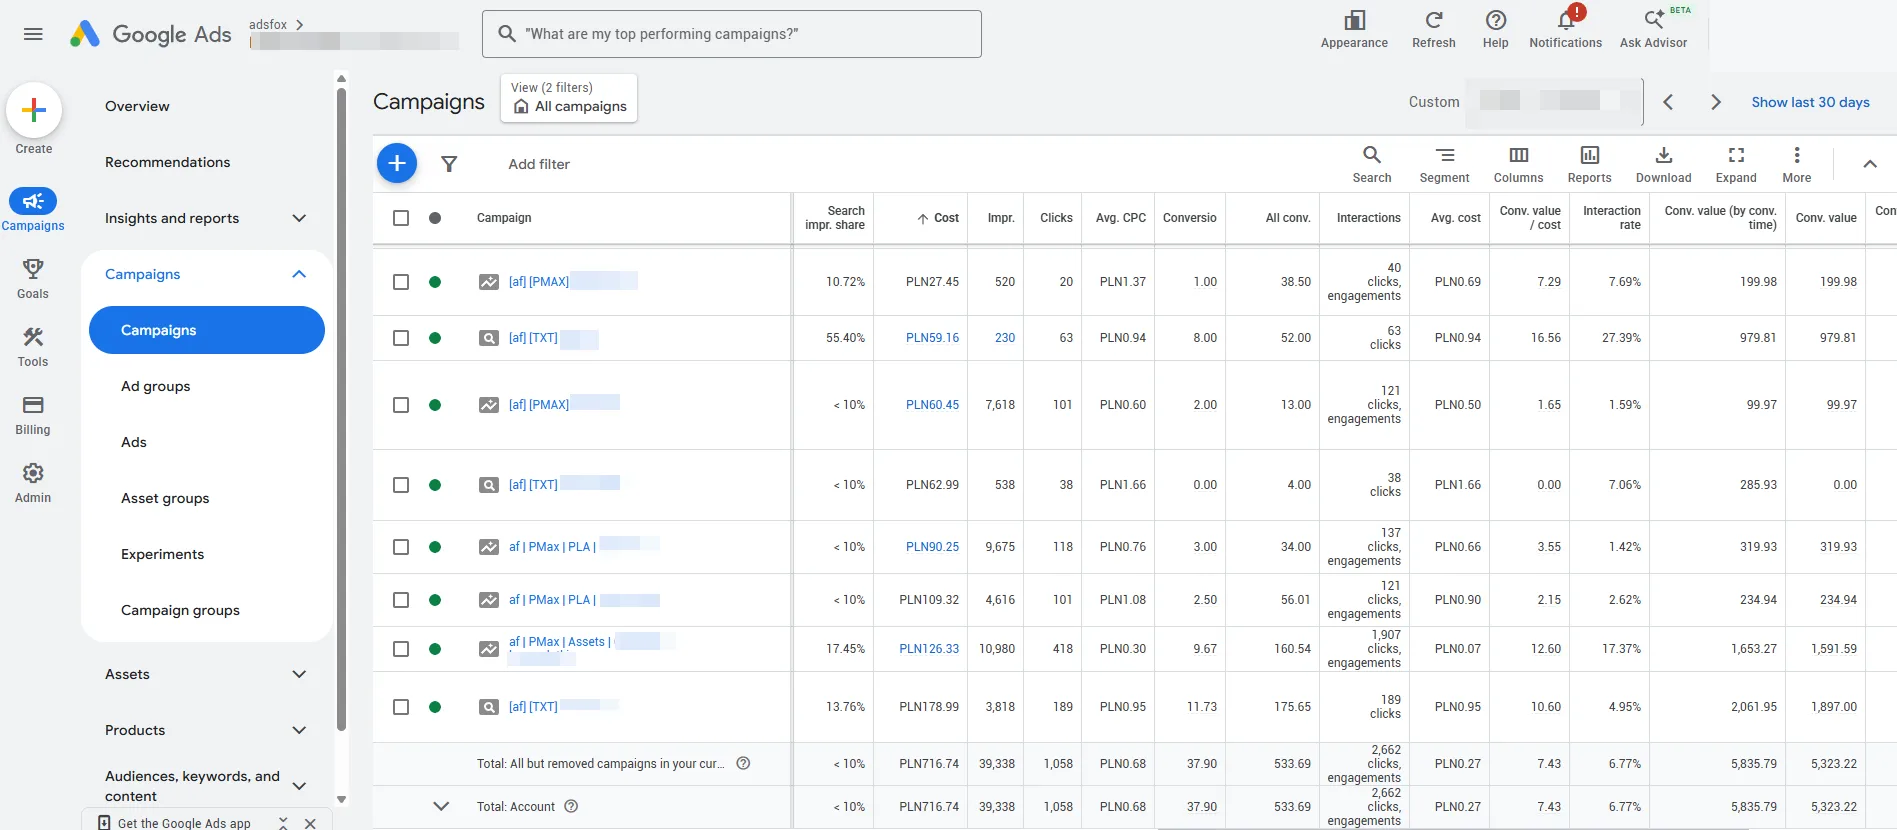
The second screenshot shows the period after the structure was cleaned up. The whole-account row shows a cost of 716.74 PLN (about $179), 37.90 attributed purchases, a ROAS of 7.43 and purchase value of 5,323.22 PLN (about $1,330).
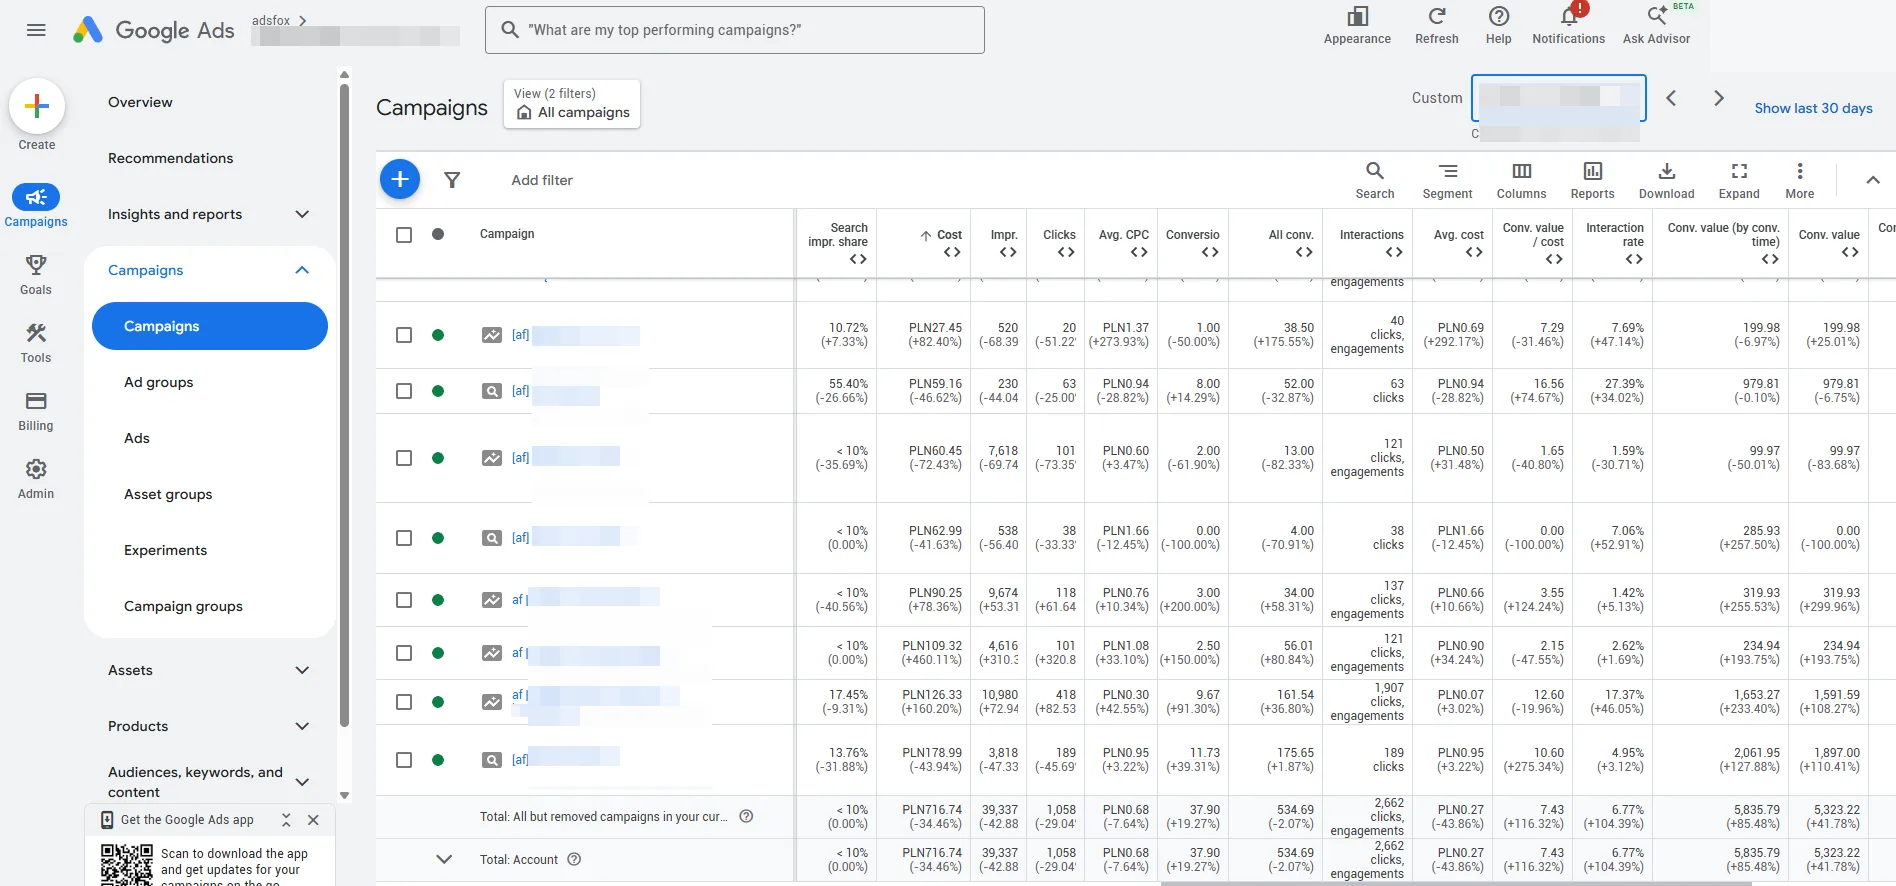
The third screenshot is a direct comparison of the two equal periods. The whole-account row shows cost down 34.46%, purchases up 19.27%, ROAS up 116.32% and purchase value up 41.78%.
What a ROAS of 7.43 means for an online store
A ROAS of 7.43 means that for every dollar spent in Google Ads, the system attributed $7.43 in purchase value. That is above the 5.00 threshold the owner set as the point to start scaling campaigns.
ROAS alone is not enough to judge profit, though. The store has to account for margin, product costs, payment processing, shipping, returns and order handling. That is why we do not present 7.43 as “seven times the profit.” It is a measure of ad spend efficiency and the basis for the next budget decision.
The most important business takeaway from this project is different: after the structure was cleaned up, the campaigns spent less while generating more purchases and higher purchase value.
What works in Google Ads for a jewelry store
Splitting the catalog by category
Charms, bracelets, earrings and rings should not automatically compete for budget on identical terms. Separate segmentation lets you see faster which category has the right volume and profitability.
Controlling product overlap
If the same SKU lands in several campaigns for no clear reason, it is harder to tell which structure performs better. Controlling overlap limits internal competition and makes budget management easier.
Watching inventory levels
Promoting products with zero stock generates traffic that cannot end in a purchase. Merchant Center and the feed have to reflect actual availability.
Judging real purchase value
The target ROAS set in a campaign is an optimization parameter, not a business result. Decisions have to be based on the actual purchase value attributed to the spend, then compared with the category’s margin.
A separate adsfox project shows how Meta Ads for a jewelry brand performed in the same industry.
What to avoid in Shopping campaigns
The most common mistake is putting the entire catalog in every campaign and expecting the algorithm to account for each category’s profitability on its own. The platform can increase the number of conversions, but it does not know the full economics of your products unless it gets the right structure and signals.
Also avoid:
- mixing categories with different margins and priorities,
- promoting unavailable products,
- pausing SKUs too quickly after a small spend,
- judging campaigns only by clicks or average CPC,
- treating a 6-day result as a confirmed level for the coming months.
What comes next for the campaign
The next steps are further budget optimization by category profitability, ongoing control of Merchant Center and inventory, and building out separate asset groups and campaigns. Further tests of feed-only campaigns versus campaigns with creative are planned, along with seasonal activity.
After a short period, the result is a basis for further testing, but it does not close the analysis. A fuller period is needed to judge how durable the 7.43 ROAS is and to make scaling decisions safely.
Do you run an online store, see a blended ROAS, and still not know which categories are actually driving the result? Book a free marketing consultation and we will review your campaign structure, Merchant Center and how budget flows between products.
We run this kind of work as part of our Google Ads agency services. Results from other projects are in our case studies.
Related adsfox services
We run Shopping and Performance Max campaigns as part of our Google Ads agency services, and sales campaigns on Facebook and Instagram through our Facebook ads agency. Organic search traffic is built separately, through our SEO agency, including e-commerce SEO. Recovering conversions lost to browser tracking limits is handled by server side tracking and the Conversions API.
Who is the client in this case study?
The client runs a jewelry e-commerce store. We publish only information that clients have agreed to in writing. To protect their competitive advantage, we do not disclose the company name, store address, website or the exact campaign period. See adsfox client reviews.