
Google Ads for an Optical Store: 44.3% Lower Cost per Conversion

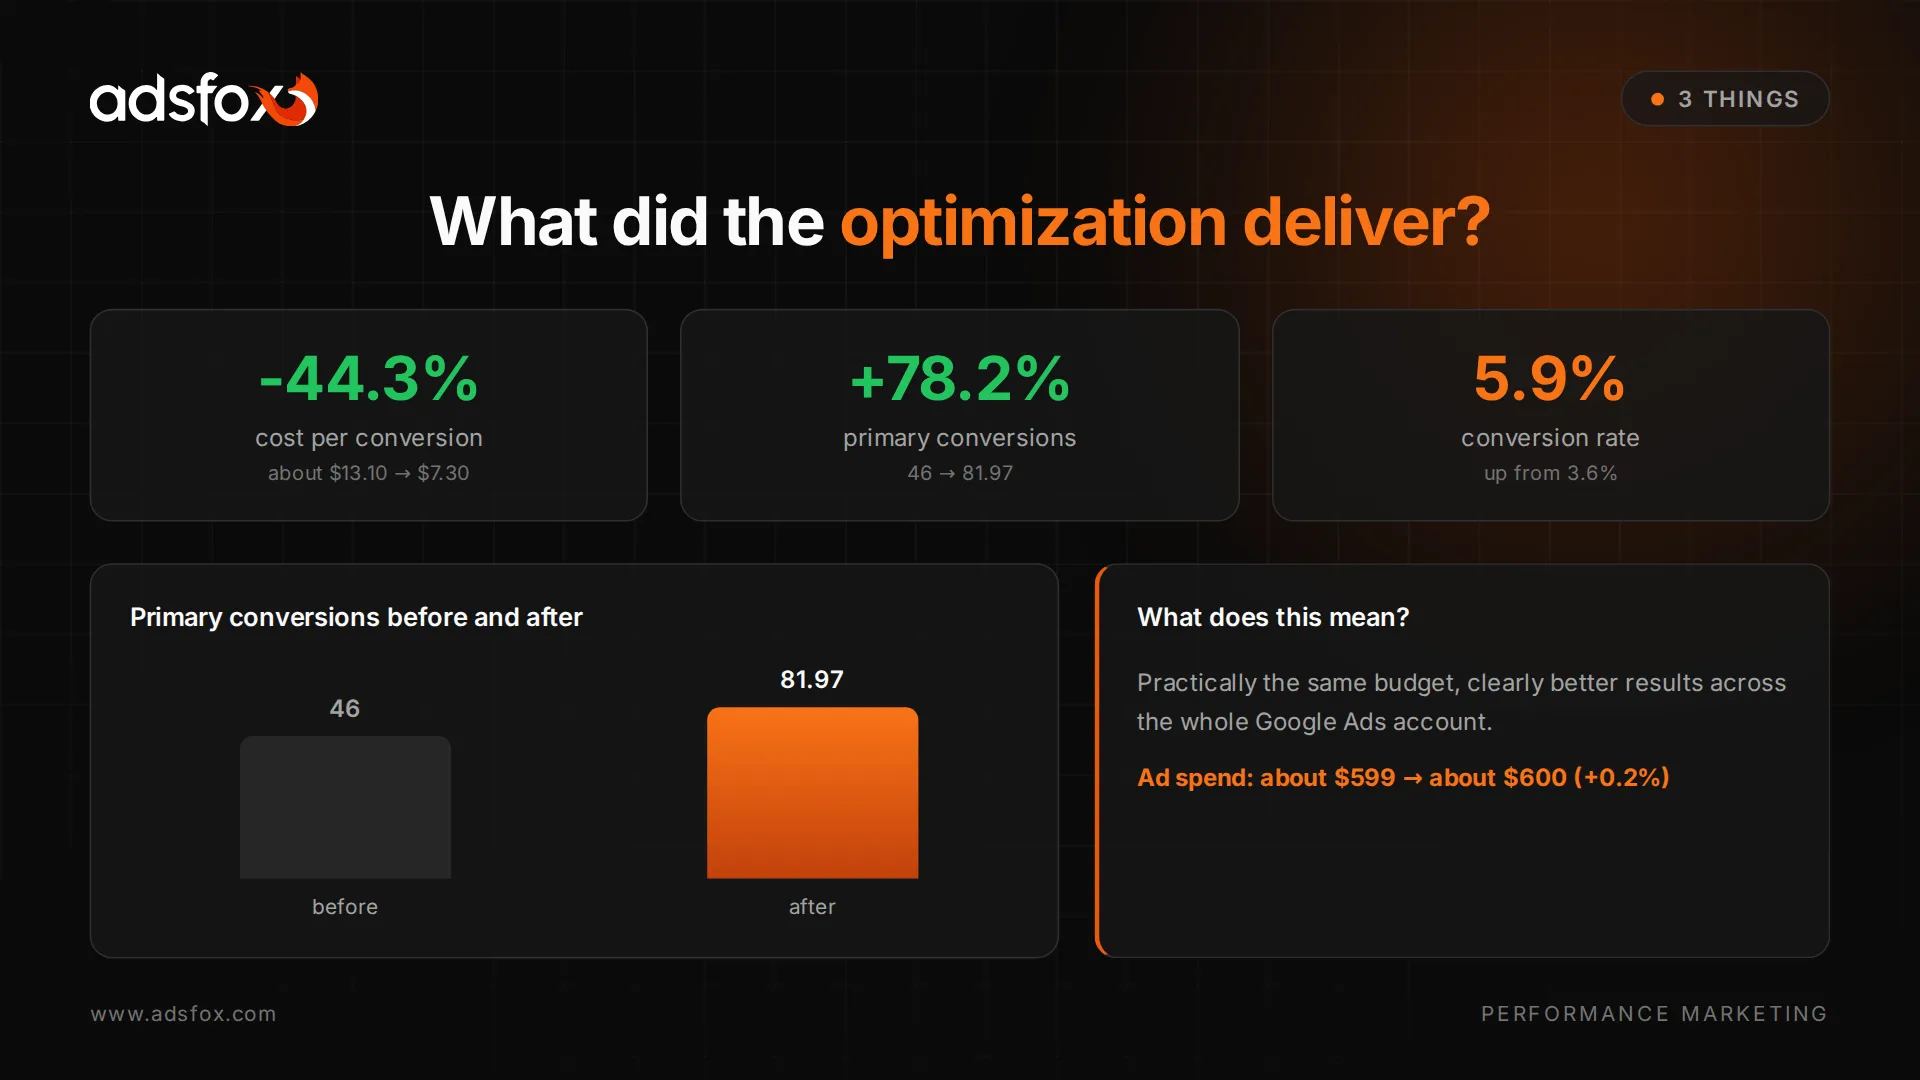
With practically the same budget, adsfox lowered the cost per primary conversion in Google Ads from about $13.10 to about $7.30. At the same time, primary conversions went from 46 to 81.97 and the conversion rate from 3.6% to 5.9%.
This case study covers a full-account Google Ads optimization for an optical store, a client in Poland. It does not rely on adding budget or on one dramatic change. The result came from cleaning up account structure, exclusions, ad assets and Performance Max campaigns.
All numbers come from the Google Ads dashboard and a comparison of two analyzed periods. Exact date ranges and any details that could identify the store are hidden. Screenshots show amounts in Polish zloty (PLN); in the text we converted them to US dollars at roughly 4 PLN per dollar.
Google Ads for an optical store: the starting point
The account was generating primary conversions, but they cost too much. Before optimization, cost per primary conversion was about $13.10 and the conversion rate was stuck at 3.6%.
The challenge was not a lack of traffic. The problem was how efficiently the budget was being used. The account needed cleanup on several levels at once:
- there was no shared negative keyword list at the account level,
- campaigns were reaching some unwanted locations,
- text assets needed work,
- some images in the Performance Max campaigns had to be replaced,
- the account contained automatically created assets that needed to be removed,
- one area was supposed to be tested in Demand Gen.
For adsfox, the goal was not more impressions at any price. We wanted to increase the number of primary conversions reported in the account and lower their cost at the same time.
What we changed in the Google Ads account
A shared negative keyword list
The first step was cleaning up exclusions. adsfox introduced a shared negative keyword list at the account level.
This let every campaign run on one consistent set of exclusions instead of separate, uncoordinated settings. We also added exclusions for unwanted locations. The location names are not published to protect the client’s anonymity.
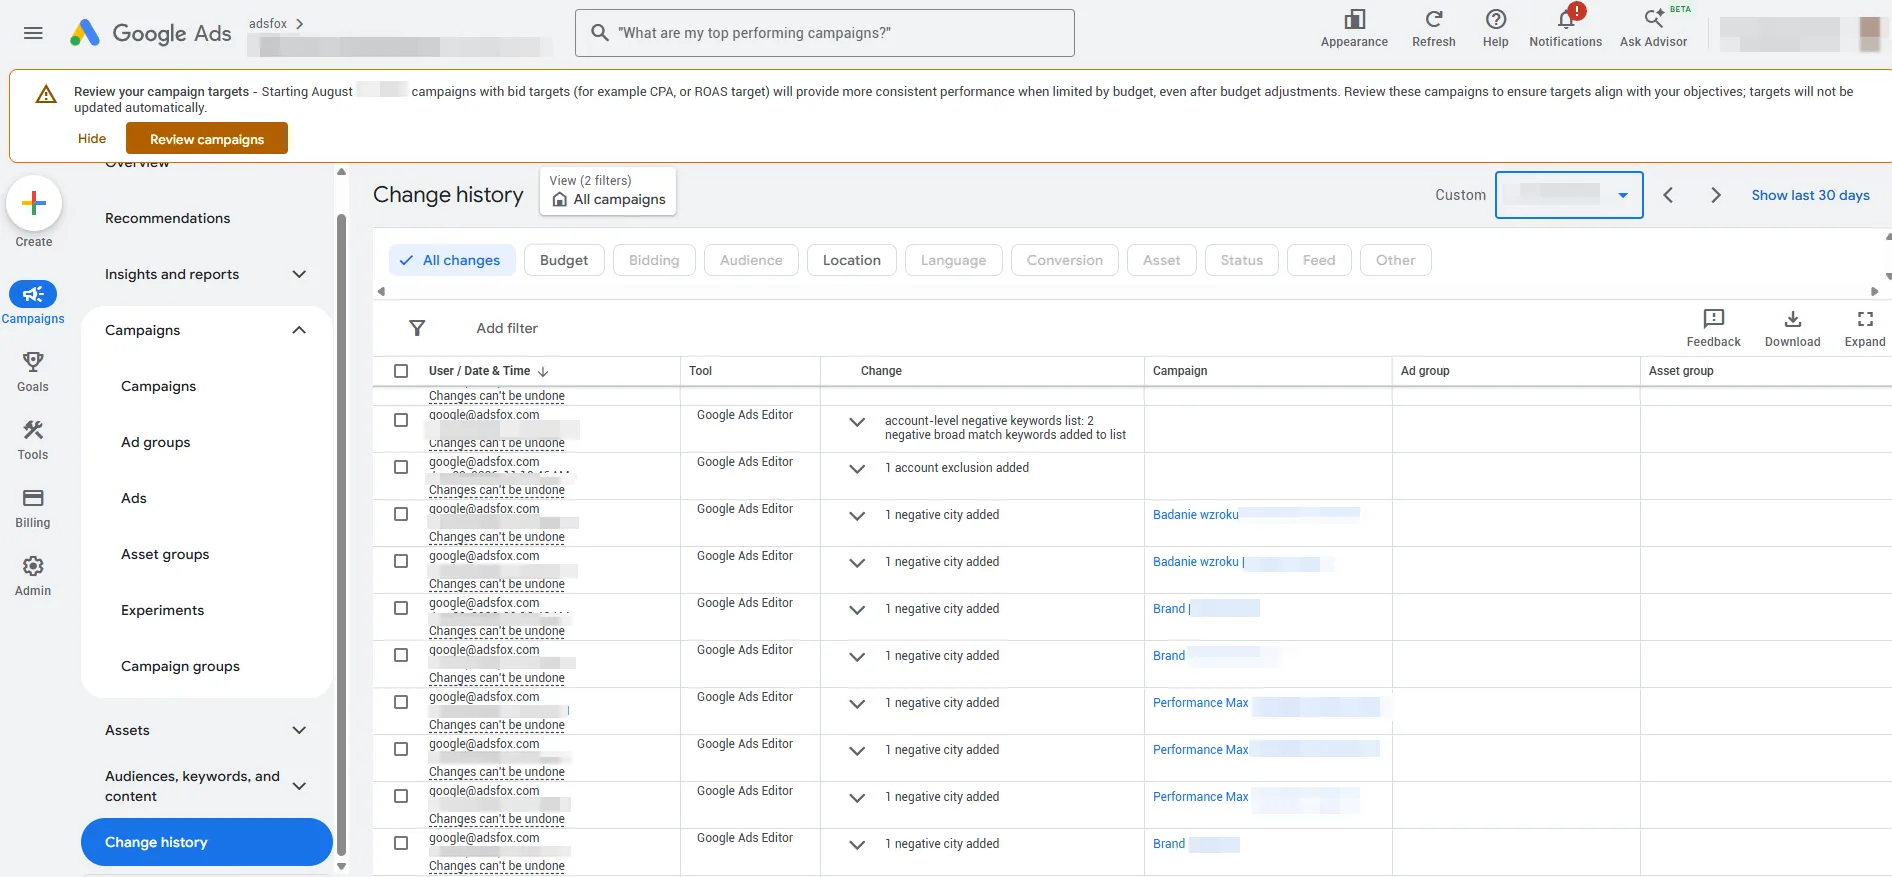
The change history screenshot below documents the adsfox team adding the negative keyword list and the location exclusions.
Text assets and Performance Max creative
The next area was ad assets. We rewrote the copy, replaced some of the images in the Performance Max campaigns and removed the automatically created assets.
This matters because a Performance Max campaign does not run on budget and bidding strategy alone. The system uses the headlines, descriptions and images you give it to build ads across Google’s placements. If the assets are inconsistent, or some were generated automatically without the team’s control, optimizing the budget by itself does not fix the problem.
In this project adsfox treated campaign structure and asset quality as one process. The result reflects the whole optimization package, so we do not credit the entire improvement to one image or one headline.
A Demand Gen test instead of a forced migration
One of the goals was to check whether a selected area of the account could move to Demand Gen. The test did not generate enough conversions, so the new campaign type did not replace the existing setup.
This is an important part of the case study. Not every optimization attempt has to be rolled out permanently. For adsfox, a test is valuable when it gives you grounds for a decision. If it does not confirm the results, we do not defend it just because it was launched.
Results for the whole Google Ads account
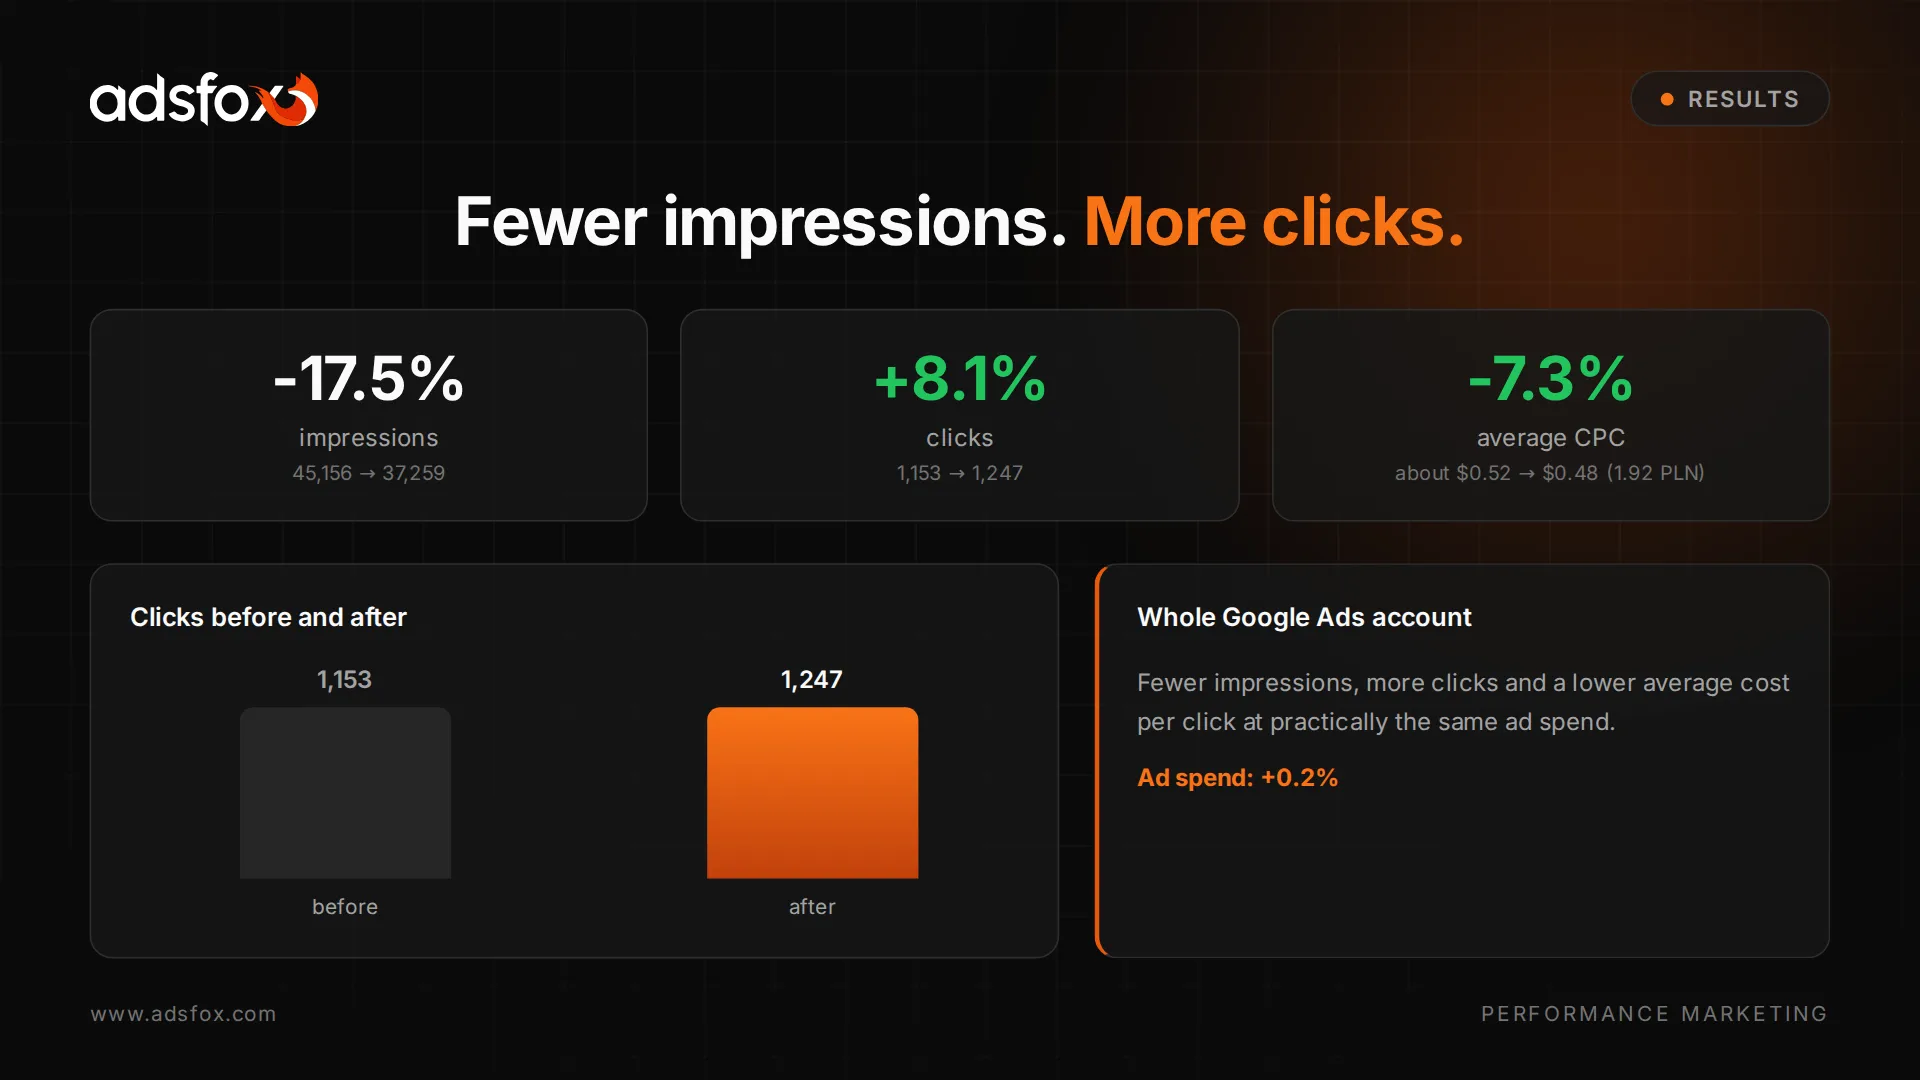
The most important outcome showed up at the account level. Ad spend stayed practically flat: it went from about $599 to about $600, a 0.2% change.
At that same budget level, adsfox achieved the following changes:
| Metric | Before optimization | After optimization | Change |
|---|---|---|---|
| Ad spend | about $599 | about $600 | +0.2% |
| Impressions | 45,156 | 37,259 | -17.5% |
| Clicks | 1,153 | 1,247 | +8.1% |
| Average CPC | about $0.52 | about $0.48 | -7.3% |
| Primary conversions | 46.00 | 81.97 | +78.2% |
| Cost per primary conversion | about $13.10 | about $7.30 | -44.3% |
| Conversion rate | 3.6% | 5.9% | up |
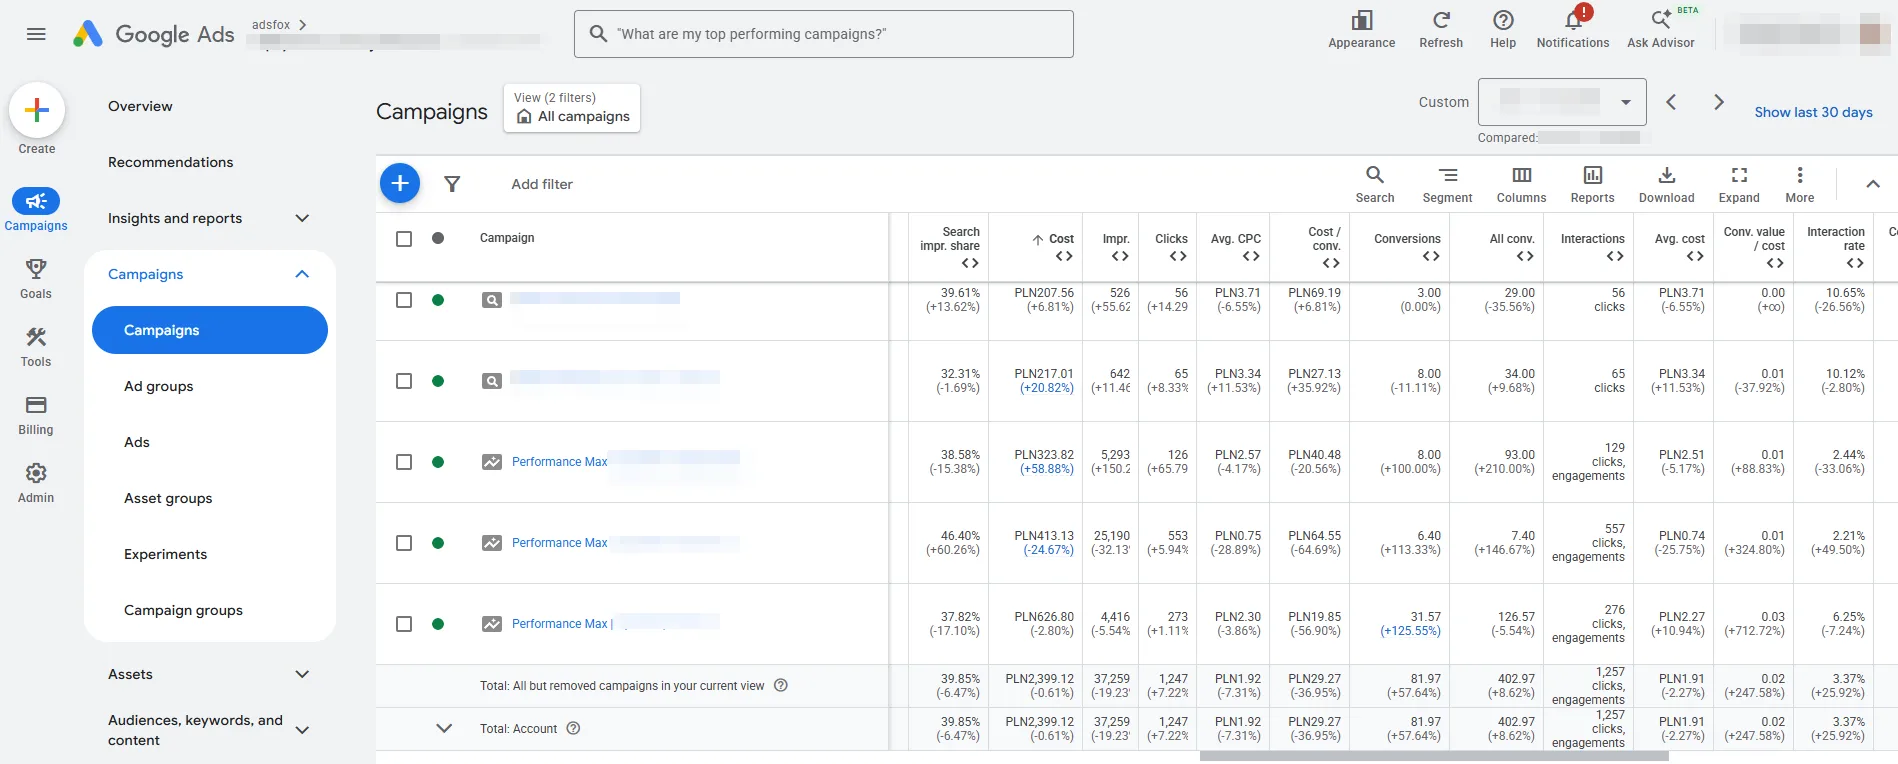
Below are the original Google Ads screenshots. Each shows a different view of the account and a different level of detail. In the published copies we hid only the details identifying the store and the date ranges.
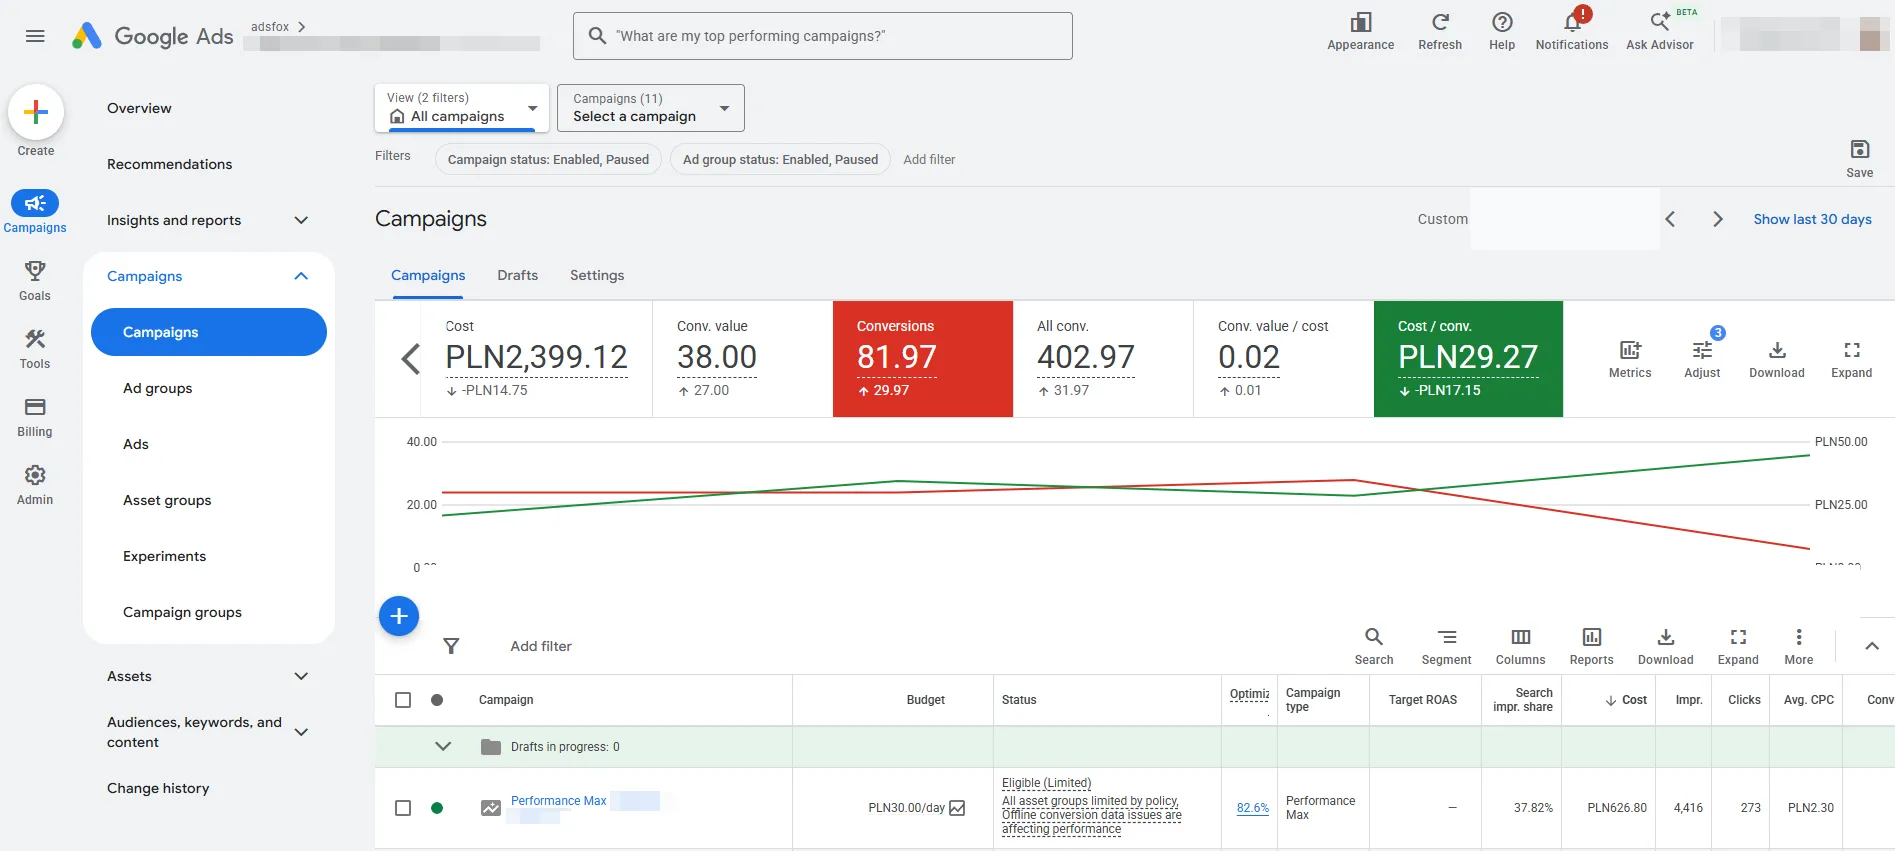
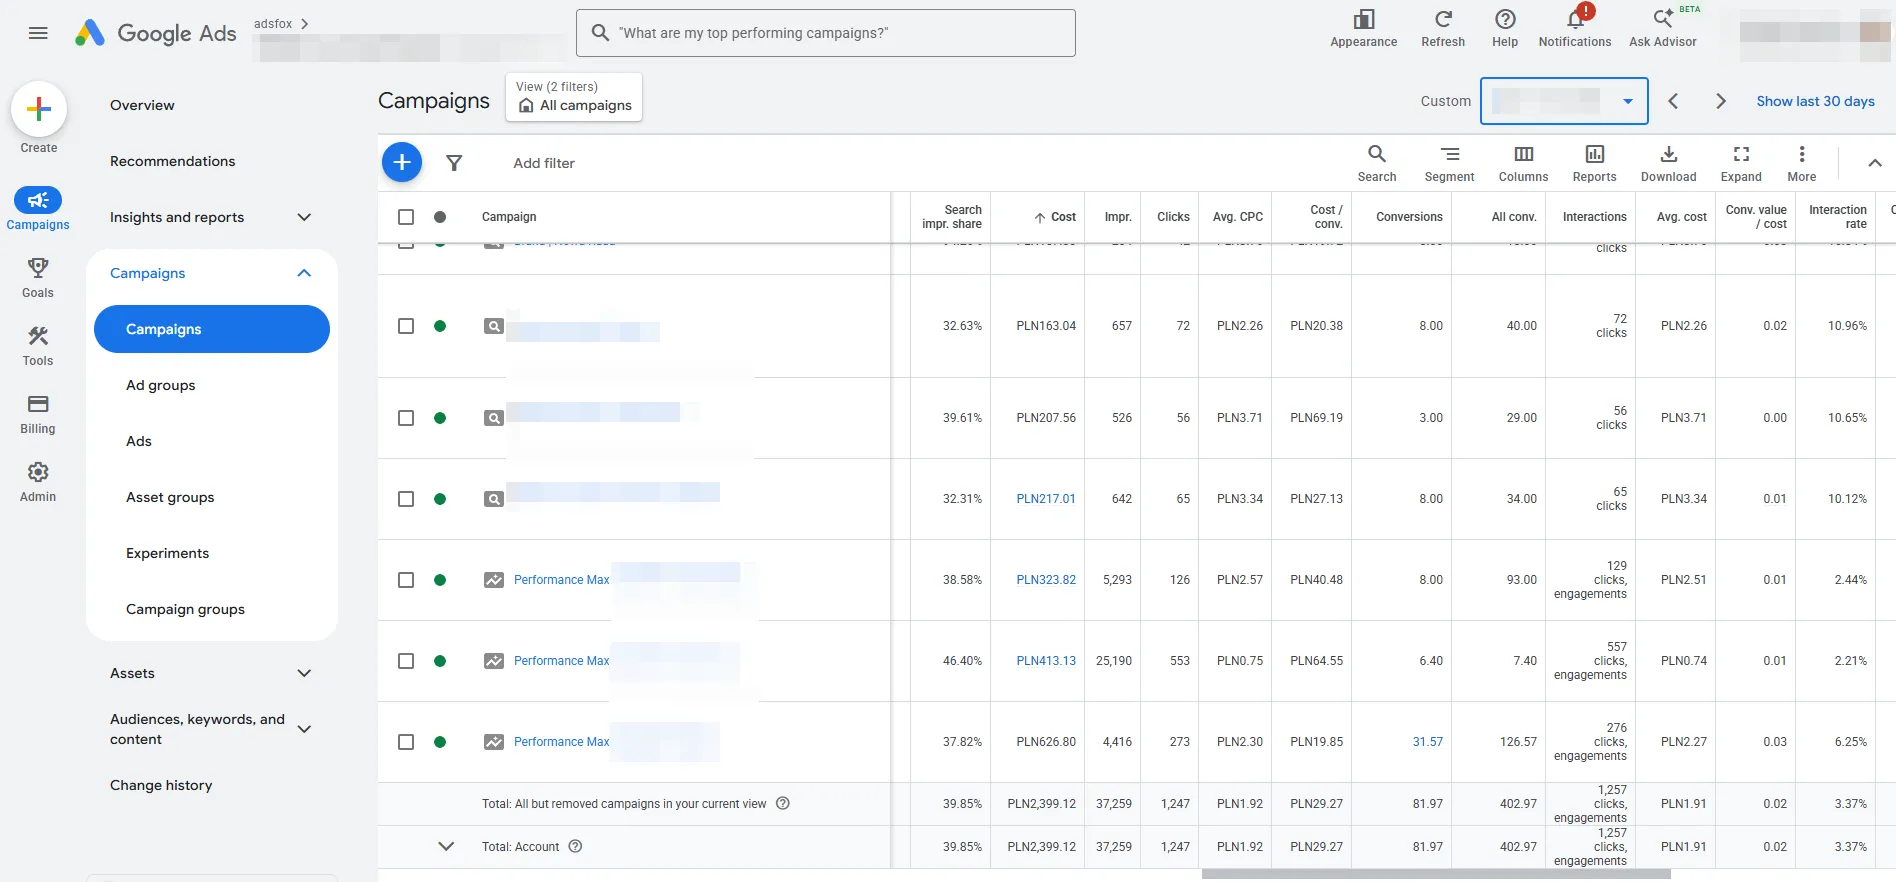
The most useful business takeaway is not “we generated more impressions.” There were fewer impressions. At the same time, clicks and primary conversions went up, and their cost dropped noticeably.
That means before you increase the budget, it is worth checking whether the current account structure uses the money efficiently. In this case, the improvement did not require a meaningful increase in spend.
Not every campaign improved the same way
The whole account did clearly better, but efficiency was still uneven across campaigns. This matters, because the account total can hide both very strong and weaker pieces.
After optimization, cost per primary conversion by campaign looked like this:
- Search campaign 1: about $17.30,
- Search campaign 2: about $6.80,
- Performance Max campaign 1: about $10.10,
- Performance Max campaign 2: about $16.10,
- Performance Max campaign 3: about $5.00.
The third Performance Max campaign had the lowest cost per primary conversion in this set. At the same time, the first Search campaign was still producing expensive conversions, and the second Performance Max campaign did worse after the changes than before.
adsfox does not hide these differences. Optimizing an account is not about declaring every campaign a success. It is about analyzing which parts deserve more investment, which need further changes, and which should not be scaled even though the account total improved.
What did not work
The project had two clear limitations.
First, the Demand Gen test did not collect enough conversions to justify replacing the existing campaign. Instead of forcing a migration, we kept the setup that had better support in the data.
Second, one Performance Max campaign ended with a worse cost per conversion after optimization. That is a signal to keep working on that specific area, not a reason to reject the changes across the whole account. adsfox’s combined result still included a 78.2% increase in primary conversions and a 44.3% drop in their cost.
An honest case study should show both levels at once: the overall improvement and the pieces that still need correcting.
What this result means for the optical store
In this material we do not equate Google Ads primary conversions with confirmed eyewear sales or a count of new customers. The result describes campaign efficiency in the dashboard, not the store’s revenue or margin.
What we can confirm is an improvement in marketing efficiency:
- the account generated more primary conversions,
- the average cost per click went down,
- the cost per primary conversion went down,
- the conversion rate went up,
- the budget stayed practically unchanged.
For a service business, the conclusion is simple: before you increase spend, check whether your campaigns have consistent exclusions, the right locations, controlled assets and a structure that lets you separate the better campaigns from the weaker ones.
We described another project from the same industry in an earlier optical store advertising case study.
How to approach optimizing your own Google Ads account
Based on this project, start with five questions:
- Do all campaigns use one consistent negative keyword list?
- Are ads shown only in the locations the business actually serves?
- Are the text and images in Performance Max controlled by your team?
- Do the automatically created assets match your offer and brand voice?
- Did a new campaign type prove itself before replacing the existing setup?
If even one answer is “I don’t know,” simply raising the budget may only scale the inefficiency. The team at our Google Ads agency can analyze your structure, tracking, exclusions and the differences between campaigns.
Book a free marketing consultation and find out whether the problem in your account is a budget that is too small, or the way it is being spent.
Summary of the engagement with adsfox
In this project adsfox did not meaningfully increase ad spend. Instead, we cleaned up the elements that decide how well an account performs: exclusions, locations, text assets, Performance Max images and automatically created assets.
The effect at the whole-account level:
- 81.97 primary conversions instead of 46,
- about $7.30 instead of about $13.10 per primary conversion,
- a 5.9% conversion rate instead of 3.6%,
- about $600 instead of about $599 in spend.
The key takeaway: better efficiency does not always require a bigger budget. Sometimes you first have to remove the things that keep your campaigns from using the money already in the account.
Related adsfox services
We do this kind of account cleanup as part of our Google Ads agency services. If you also want to reach customers on Facebook and Instagram alongside search, our Facebook ads agency handles that. Organic search demand is built separately by our SEO agency, including local SEO for stores with a physical location. If you are not sure where your budget is leaking today, start with a digital marketing audit, and you can find results from other projects in our case studies.
Who is the client in this case study?
The client runs an optical store. We publish only information that clients have agreed to in writing. To protect their competitive advantage, we do not disclose the company name, store address, website or contact details. See adsfox client reviews.